FAQs
Contents
- 1 How to check status of KHIKA Aggregator i.e. Node ?
- 2 How to check if raw syslog data is received in the system? What if it is not received?
- 3 Troubleshoot connection error between KHIKA appserver to Data Aggregator.
- 4 How to see raw log data on Discover Screen?
- 5 How to select data related to a particular device on your Dashboard?
- 6 How do I estimate my per day data?
- 7 SMTP settings in KHIKA
- 8 Integrating log data from a device via Syslog
- 9 Integrating log data from device via Ossec
- 9.1 Failing to add ossec based device
- 9.2 Device Data is not visible in KHIKA
- 9.3 Ossec Agent And Ossec Server Connection issue
- 9.4 Data Collection Issue event if the agent is successfully connected to OSSEC Server.
- 9.5 Failing to Remove Ossec based device.
- 9.6 How to Find list of ossec agents along with it's status on command line
- 9.7 How to check logs in Linux Ossec Agent
- 9.8 How to check logs in Windows Ossec Agent
- 9.9 How to check OSSEC Server logs
- 9.10 How to Stop OSSEC Server using command line
- 9.11 How to Stop OSSEC Agent using command line
- 9.12 How to Start OSSEC Server using command line
- 9.13 How to Start OSSEC Agent using command line
- 9.14 How to Restart OSSEC Server
- 9.15 How to Restart Windows Ossec Agent
- 9.16 How to Restart Linux Ossec Agent
- 9.17 How to Reinstall OSSEC Agent for Windows
- 9.18 How to Reinstall OSSEC Agent for Linux
- 10 KHIKA Disk Management and Issues
- 10.1 Most probable reasons why Disk is Full
- 10.2 Size of indexes representing raw logs grows too much
- 10.3 Log files of KHIKA processes not deleted
- 10.4 Postgres database size has increased
- 10.5 Report's files not getting archived
- 10.6 Raw log files not getting archived and deleted for ossec and syslog devices
- 10.7 Cold/Offline storage partition gets full or unmounted
- 10.8 Elasticsearch snapshot utility not working properly
- 11 Elasticsearch Snapshot functionality configuration
- 12 Check Status of Snapshot / Restore Functionality
- 13 Alerts in KHIKA
- 13.1 What to do when an alert is triggered
- 13.2 How to provide access to alerts for a workspace to User?
- 13.3 What to do alerts are not visible on the Alert Dashboard despite alert getting raised or alert emails being received?
- 13.4 What to do if alerts are not receiving through emails for a particular alert?
- 13.5 Email is configured for an alert but not receiving the emails for the alert.
- 13.6 How to disable / Enable the alert?
- 13.7 Can we write new alert rules?
- 13.8 Reduce Noisy alerts/suppression for an alerts
- 13.9 Alert is not wanted for a particular device or user ( whitelisting/blacklisting of alert)
- 13.10 Configure Alert Analysis
- 13.11 Why are we getting "Device not sending any data" alert ?
- 14 How to use search string while searching the data in KHIKA
- 14.1 Data cannot be searched in KHIKA
- 14.1.1 Case 1. Check that you have selected appropriate index
- 14.1.2 Case 2. Check that search string you are using is correct
- 14.1.3 case 3. Specific data is not present for a particular time or time range is incorrect
- 14.1.4 Case 4. Eserver not indexing data due to mapping related error
- 14.1.5 Case 5: Parsing Error
- 14.1.6 Case 6: Raw logs not coming
- 14.1.7 Case 7: Configured Device has incorrect time
- 14.2 Error while searching
- 14.1 Data cannot be searched in KHIKA
- 15 Reports in KHIKA
- 16 Dashboards in KHIKA
- 17 Troubleshooting of KHIKA process related problems
- 18 While adding device in KHIKA get message "You have added maximum number of licensed devices. Please contact Support for help in this regard".
- 19 While accessing KHIKA UI for login you get the message like "The license information could not be loaded. Please contact your system administrator".
- 20 How to configure backup for a KHIKA Node ?
- 21 How to add a server for Server Hardening Compliance Report ?
- 22 How to resume/stop KHIKA services after/prior server reboot?
- 23 How to start/stop KHIKA Services on a particular node?
- 24 How to configure KHIKA Services on a particular node?
- 25 How to give a user access to a certain workspace
- 26 How to use Kafkatool to do a KHIKA Healthcheck ?
How to check status of KHIKA Aggregator i.e. Node ?
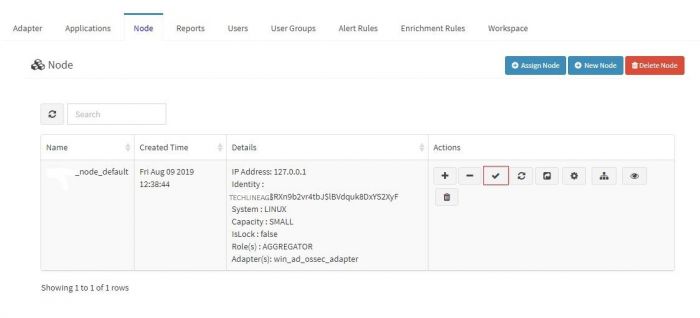
1. Go to Configure panel on left side menu and then click on Node tab

2. Now you see list of KHIKA aggregator (Nodes)
3. Click on "Check Aggregator Status" button next to node name for which you want to check status.

4. If the KHIKA Aggregator i.e. node is connected to KHIKA Appserver, you will get popup like "Nodename Aggregator is connected to KHIKA".

5. Otherwise the operation will timeout with an error message indicating the node is not connected to KHIKA.

To troubleshoot the connection issue between the KHIKA Application Server and Aggregator, click here
How to check if raw syslog data is received in the system? What if it is not received?
In the section for adding data of syslog based devices we have explained how to enable syslog forwarding on the the data sources first and then add that device into KHIKA. When we add a device successfully, we can see the device entry in the “List of Devices” tab. (For this, go to Configure – Adapter – Manage Devices next to that Adapter.)

However if raw syslogs are not received from that device, we get an error while adding the device.
It is recommended to wait for upto 10 minutes before checking its data. However please note that some devices (e.g. switches & routers) may not log data very frequently and hence log data may not be received by KHIKA in the 10 min period despite all the required configuration being done properly. In such a scenario, it is best to check if any logs are generated on the device's native console in the 10 mins period and then verify whether the same logs are received by KHIKA.
To check whether we are receiving this device’s data in KHIKA, go to “Discover” screen from the left menu. Search for the IP address of the device in the search textbox on the top of the screen.
In our example from the image, IP address is “192.168.1.1”. In the search bar in the Discover screen, just enter “192.168.1.1”. This is for showing up any and all data relevant to the device with this IP.

If you can see data for this IP address, the logs are being received into KHIKA successfully.
If not, please check section for adding data of syslog based devices. Both the steps – adding a device in KHIKA as well as forwarding syslogs from that device to KHIKA should be verified again.
Troubleshoot connection error between KHIKA appserver to Data Aggregator.
First check data aggregator is connected to khika appserver. Do following steps to check the data aggregator status.
   1.Login to khika UI using apropriate credentials.
   2. Go to "Configure" tab.Click on "Node" tab.
   3. Click on "Check Aggregator Status" button.
If you get "Remote_Agent service of the <node_name> aggregator is not connected to KHIKA" message in status popup, it means your aggregator is not connected KHIKA appserver.

There are some possibilities why data aggregator is not connected to appserver.
1. Identity key is mismatched
2. Kafka server ip is not set properly
3. Date of khika aggregator server is not set properly
4. KHIKA Appserver is not reachable
5. KHIKA appserver is reachable but not connected
Identity key is mismatched
This type of error occurs if your identity key from KHIKA UI does not match with the aggregator's identity key.
If error like "TOPIC_AUTHORIZATION_FAILED" is present in "RemoteClient_collection.log" log file, which is present in "/opt/KHIKA/collection/log/" path this mean that identity keys are mismatched.Error is shown in the next screenshot.

Do the following steps to matched both identity keys.
1. Go to /opt/KHIKA directory.
cd /opt/KHIKA/
2. run "khika_configure.sh".
./khika_configure.sh
3. Go to KHIKA UI and login into KHIKA.
4. Go to "Configure" tab and then click on "Node" tab.
5. Copy Identity from UI
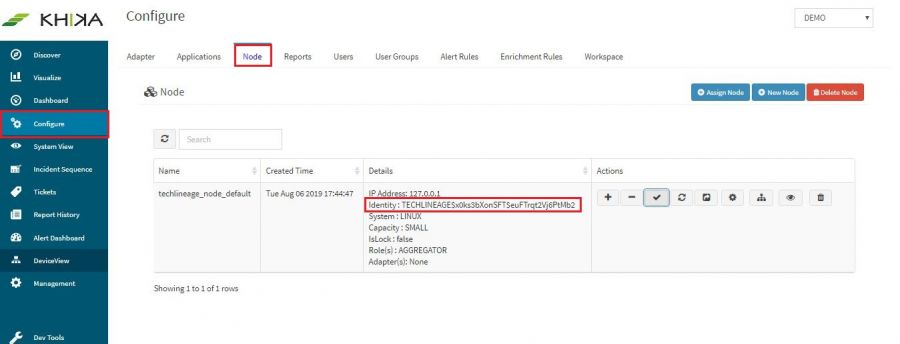 6. when khika_configure script is running enter copied identity key in "Specify the KHIKA Identity:" section.
7. Press Enter."KHIKA Data Aggregator service will start now. Please wait for some time" message is displayed.
6. when khika_configure script is running enter copied identity key in "Specify the KHIKA Identity:" section.
7. Press Enter."KHIKA Data Aggregator service will start now. Please wait for some time" message is displayed.
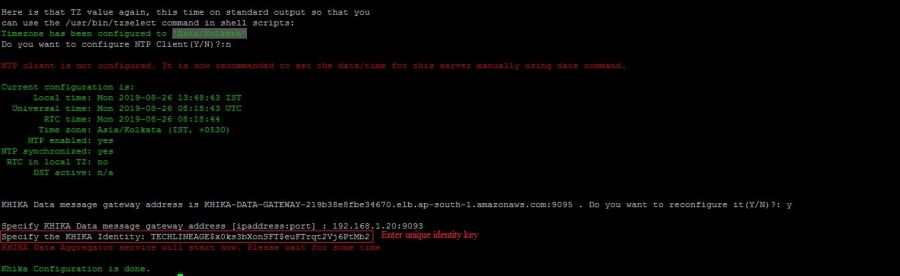


After some time you got "Khika Configuration is done" message. Then check process is running or not using the following command.
ps -ef | grep RemoteClient
and check the status of Data Aggregator from UI. to check the Status of Data Aggregator click here
Kafka server ip is not set properly
This type of error is occurred when your kafka server ip of khika appserver is not given to data aggregator.
If "DNS resolution failed for <Server_ip>" and "Closing the kafka producer with timeoutMillis = 0ms" and "Shutdown hook has called" type of messages are present in "RemoteClient_collection.log" log file, which is present in "/opt/KHIKA/collection/log/" path this mean your data aggregator is not connected to appserver because of kafka ip is incorrect.
Error is shown in the next screenshot.

Do the following steps to solve the issue.
   1. Go to /opt/KHIKA directory.
      cd /opt/KHIKA/
   2. run "khika_configure.sh".
      ./khika_configure.sh
   3. After NTP configuration it will ask the setup for Gateway address.Click "Y" to setup gateway.
   4. Enter the IP_addtess and port "Specify KHIKA Data message gateway address [ipaddress:port] : " section.
      Note: use 9093 port for SASL authentication
   5. Go to KHIKA UI and login into KHIKA.
   6. Go to "Configure" tab and then click on "Node" tab.
   7. Copy Identity from UI
   8. when khika_configure script is running enter copied identity key in "Specify the KHIKA Identity:" section.
   9. Press Enter."KHIKA Data Aggregator service will start now. Please wait for some time" message displayed.
After some time you got "Khika Configuration is done" message. Then check process is running or not using the following command.
ps -ef | grep RemoteClient
and check the status of Data Aggregator from UI. to check the Status of Data Aggregator click here
Date of khika aggregator server is not set properly
This type of error is occurred if date and time is not set properly on your data aggregator server.
check if the following type of error is occurred in "RemoteClient_collection.log" log file, which is present in "/opt/KHIKA/collection/log/" path this mean Date and Time is not set properly.

To solve this issue do following steps
1. Stop all process using following command.
./stop.sh
2. Set date and time
Example: sudo date -s "26 Aug 2019 13:14:00"

3. Start all process using following command
./start.sh
then check Aggregator status from here
After Solve above problems go to "/opt/KHIKA/collection/log" directory and check "RemoteClient_collection.log"
See the below screenshot to check the status of data aggregator from backend below type of messages are displayed in log file

KHIKA Appserver is not reachable
First check,IF KHIKA Appserver is reachable from your Data aggregator, use the following command to check connection
ping 192.168.1.20
If the appserver is unreachable then contact your network team and try to connect.
There are some possibilities regarding network
1. Data aggregator has no access to internet.
2. Aggregator and appserver are not in the same network.
3. If the subnet is different then make sure you have a firewall rule that will allow the connection between Data Aggregator and Appserver.
4. Firewall is running on Data Aggregator.
firewalld service should not be running/active on Data Aggregator.
check firewalld service is running on data aggregator using the following command
systemctl status firewalld.service
If firewalld service is running/active use the following command to stop firewalld service.
   systemctl status firewalld.service

   systemctl disable firewalld.service
How to see raw log data on Discover Screen?
On the Discover screen, you have to choose 2 things to bring up your data :
- Time duration
- Index pattern
Select the required index pattern from the dropdown on the left of the Discover Screen. This selects your data type and whether it is “raw” or calculated “rpt” data. Refer section for help on changing index
Then select the time duration of data you want to see from the time picker functionality on top right. Selecting time window is explained here
If time duration is selected too large, it may severely affect the performance of KHIKA Search. We recommend not selecting the data beyond Last 24 hours. Your searches may time out if you select large Time Ranges.
Reduce your time window and try again. It is advised to keep a lesser time window. However on the contrary, if there is no / very less data in the picked time window, you might want to increase your time window from the time picker and load the screen again.
Every dashboard in KHIKA will have data for multiple devices in it. For example, a Linux logon dashboard has information about all the Linux devices in the "LINUX" workspace (the name of the relevant workspace appears as prefix before the name of the dashboard).
To see data on the dashboard for only one Linux device, you have to select the required device on your Dashboard. There are couple of ways to select an APV on your dashboard :
- Add a filter
- Enter Search query
The following procedure is applicable to all Dashboards.
Steps for Adding a Filter
On each dashboard, there is an option, “Add a filter”. Click on the “+” sign to add a new one. Use the simple drop downs in combination, to create your logical filter query.


The first dropdown is the list of fields from our data. We have selected “username” here. The second dropdown is a logical connector. We have selected “is” in this dropdown. The third dropdown has the values of this field. We have selected one device say sayali_w here. So now, our filter query is: “username is sayali_w”
Click on Save at the bottom of this filter pop up.
Your Dashboard now shows data for only the selected device in all the pie charts, bar graphs, and summary table – everywhere in the dashboard.
The applied filter is seen on top.

To remove the filter, hover on the filter icon on top (selected in red in above figure). Icons appear. Click on the bin icon ifaq3.1 to remove the filter. The Dashboard returns to its previous state.

Please Note: If this is just a single search event, do not follow further steps. If you want to save this search for this particular device with the Dashboard, follow steps given further to save the search.
Click on Edit link on the top right of the Dashboard – Save link appears. Click on Save to save this search query with the dashboard.

The filter currently applied shall continue to be seen on top of your Dashboard. You can remove this filter at any point of time in the future by clicking on the bin icon on your dashboard – as already explained.
Steps to Search and Save
On the top of the Dashboard, there is a text box for search. Enter your device search query for a particular device in this box.

We have entered maliciousip:”103.30.143.112” . This is the syntax for maliciousip equals to 103.30.143.112. Click on the rightmost search button in that textbox to search for this particular device on the dashboard.
All the elements on the Dashboard shall now reflect data for the selected device.

Please Note : If this is just a single search event, donot follow further steps. If you want to save this search for this particular device with the Dashboard, follow steps given further to save the search.
Click on Edit link above the search textbox – Save link appears. Click on Save to save this search query with the dashboard.


This shall stay with the Dashboard and will be seen every time we open the Dashboard. To remove the search, select the search query which you can see in that textbox, remove / delete it. Click on Edit and Save the Dashboard again. It changes back to its previous state.
How do I estimate my per day data?
Please refer the dedicated section to calculate your per day data size in KHIKA
SMTP settings in KHIKA
We need to make SMTP settings in KHIKA so that KHIKA alerts and reports can be sent to relevant stakeholders as emails.
Please refer the dedicated section for SMTP Server Settings
Integrating log data from a device via Syslog
Syslog service is pre-configured on your KHIKA aggregator server (on UDP port 514). Syslogs are stored in /opt/remotesylog directory with IP address of the sending device as directory name for each device sending data. This way, data of each device is stored in a distinct directory and files. For example, if you are sending syslogs from your firewall which as IP of 192.168.1.1, you will see a directory with the name /opt/remotesylog/192.168.1.1 on KHIKA Data Aggregator. The files will be created in this directory with the date and time stamp <example : 2019-08-08.log>. If you do a "tail -f" on the latest file, you will see live logs coming in.


When you want to add a new device into KHIKA
1. Note the IP address of your KHIKA Data Aggregator.
2. Please refer to OEM documentation on how to enable Syslogs. We encourage you to enable the lowest level of logging so that you capture all the details. Syslog server where logs should go is IP address of your KHIKA Data Aggregator and port should be UDP 514.
   For enable syslog of preconfigured apps in KHIKA click on the below link:
   • Symantec Antivirus
   • Cisco Switch
   • Checkpoint Firewall
   • Fortigate Firewall
   • PaloAlto Firewall
   • Sophos Firewall
3. Note the IP address of the device sending the logs (example 192.168.1.1)
4. Now go to KHIKA Data Aggregator and login as "khika" user and do "sudo su".
5. cd to /opt/remotesylog and do "ls -ltr" here. If you see the directory with the name of the ip of the device sending the data, you have started receiving the data in syslogs.
Data is not received on KHIKA Data Aggregator
- Please wait for some time.
- Some devices such as switches, routers, etc doesn't generate too many syslogs.
- It depends on the activity on the device. Try doing some activities such as login and issue some commands etc. The intention is to generate some syslogs.
- Check if logs are generating and being received on KHIKA Data Aggregator in the directory "/opt/remotesylog/ip_of_device". Do ls -ltrh
- If logs are still not being received, Please check the following points.
- Check firewall settings on KHIKA Data Aggregator. Wait for some time perform some actions on the end device to generate logs and check in directory /opt/remotesylog/ip_of_device. Do "ls -ltr"
   Check firewall status
   systemctl status firewalld
   If firewall status is active, then do the following commands to inactive and disable firewalld.
   systemctl stop firewalld
   systemctl disable firewalld
   Flush iptables
   sudo iptables –flush
- Check if there is any firewall between KHIKA Data Aggregator and allow communication from device to KHIKA Data Aggregator on port 514 (UDP)
- Login to KHIKA Data Aggregator and do tcpdump
sudo tcpdump -i any src <ip_of_ device> and port 514
If you see the packets being received by tcpdump, restart syslog service using command.
   systemctl syslog-ng stop, Then wait for some time.
   systemctl syslog-ng start
Make sure you are receiving the logs in the directory /opt/remotesylog/ip_of_device Go to Started Receiving the logs only after you start receiving the logs.
Received log data on KHIKA Data Aggregator
Now you need to add a device from KHIKA GUI.
If the similar device of a data source has already been added to KHIKA
- Add this device to the same Adapter using following steps explained here.
- Else, check if App for this device is available with KHIKA. If the App is available, load the App and then Add device to the adapter using the steps explained here.
- Else, develop a new Adapter (and perhaps a complete App) for this data source. Please read section on how to write your own adapter on Wiki, after writing your own adapter, testing it, you can configure the adapter and then start consuming data into KHIKA. Explore the data in KHIKA using KHIKA search interface
Integrating log data from device via Ossec
The KHIKA Data Aggregator embeds an OSSEC Server which receives logs data from ossec agents installed on server devices.
Failing to add ossec based device
1. Time out Error
Check if you are getting following Error while adding the device.

This means your aggregator may not be connected to KHIKA Application Server.
Please proceed to check if the aggregator is connected to KHIKA server.
   1. Go to node tab in KHIKA GUI.
   2. Click on Check Aggregator Status button as shown in the screenshot below


   3. If it shows that the aggregator is not connected to KHIKA Server, it means that your aggregator is not connected to KHIKA AppServer.Click here to check Data Aggregator status

2. Device is already present
Check if you are getting the following message while adding the device

We cannot add the same device twice, Check if you already have added the device in the device list.
Device Data is not visible in KHIKA
Check your agent status to see if it is connected to OSSEC Server(KHIKA Aggregator).
To find the list of ossec agents along with its status click here
If it is showing the result as Active then we might first see if our search string is right. There might be some cases where we are using wrong search string or wrong index pattern to search for the data.
1. Go to the workspace in which the device is added.
2. Check-in which workspace the device is added, refer the following screenshot

3. We may need to select appropriate index pattern in which data can be searched for requested server.
4. Check Data is available on Discover page

5. In the search bar, we should include the server name to check if related logs are coming or not.
   Examples:
   1. If customer name is XYZ and if the server is in windows_servers workspace then we must select <XYZ>_<<WORKSPACE_NAME>_<ID>>_raw_<tl_tag> index pattern.

   2. tl_src_host : “<servername>”
6. If you don’t find data from this device using above steps, you need to check if the device is actually generating any log data at all or not. In case of a Windows server, you will need to check if events are getting logged in security or system event log via the event viewer. In case of a Linux server, you should check if any messages are getting logged in syslog files.
Ossec Agent And Ossec Server Connection issue
Ossec Server not running
There could be a problem where ossec server is stopped and is not running.
Go to node tab and click on Reload Configuration button to restart the ossec server.To check how to restart ossec server click here

If there is any error in restarting ossec server, the KHIKA aggregator may not be connected to KHIKA Appserver. Please click here to check status of KHIKA Aggregator (i.e. Node).
Firewall between the agent and the server
If there is a firewall between the agent and server blocking the communication, you have the following message on the Linux agent log or Windows agent log.
Waiting for server reply (not started)
Resolution: Check with your concerned firewall team, if there is a firewall between ossec agent and the ossec server. You may need to open UDP 1514 port between ossec server and ossec agent. You can check traffic on between ossec agent and ossec server (KHIKA Aggregator) using the following command
tcpdump -i eth0 src xx.xx.xx.xx and port 1514
Where, eth0 is an ethernet interface this maybe with a different name on your server
xx.xx.xx.xx is an IP address in you case server IP-address if an agent, 1514 is a port address of ossec server. See the following screenshot for reference.

To identify the correct interface to use for tcpdump, use the command 'ifconfig' and then choose the interface that corresponds to the ip address on which ossec server is listening. e.g. If ip address is 10.12.216.29, the interface would be eth1. please refer the screenshot.

Wrong authentication keys configured
If that’s the case, you would be getting logs similar to Waiting for server reply (not started) on the agent side and Incorrectly formated message from 'xxx.xxx.xxx.xxx'. on the server-side.
1. Check Windows Ossec agent logs
2. Check Linux Ossec agent logs
3. Check Ossec server log
Resolution :
You must add correct key for agent which is generated by ossec server.
1. Importing the ossec key to Windows ossec agent
2. Importing the ossec key to Linux ossec agent
Ossec agent was already installed
Before installing ossec agent please check, is ossec agent is already installed. If ossec agent is already installed and we try to install it overrides the existing configuration which may lead to a connection issue, so if ossec agent already installed go to the install path and please follow below steps.
1. For Windows
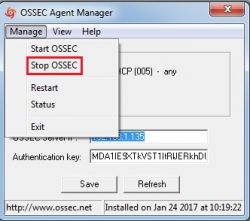
a. Stop Ossec Agent
b. Remove/ rename ossec folder agent_folder
c. Reinstall the osssec agent
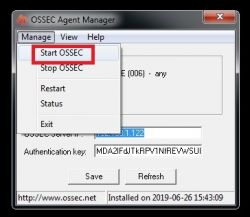
d. Start Osssec agent


2. For Linux -
    a. Stop Ossec Agent

    b. Remove / rename ossec directory  ie. our Linux server. mv /opt/ossec /opt/ossec_bak

    c. Reinstall the ossec agent.

    d. Start Osssec agent
Ossec issues in linux agent.
1. If you have logs similar to the following in /opt/ossec/logs/ossec.log.Click here to check Linux ossec agent logs:
ERROR: Queue '/opt/ossec/queue/ossec/queue' not accessible: 'Connection refused'. Unable to access queue: '/var/ossec/queue/ossec/queue'. Giving up.
This problem occurs when there is an issue related to permissions or ownership of client.keys file.(/opt/ossec/etc/client.keys).It should be something as given below.

In the above screenshot read permission for group “ossec” is not set for file client.keys
To solve this issue please set the permission and ownership of client.keys as follow:
1. Do ssh Login as user khika
2. Set root user using sudo su command.
3. cd /opt/ossec/etc/
4. chmod 440 client.keys
5. chown root:ossec client.keys
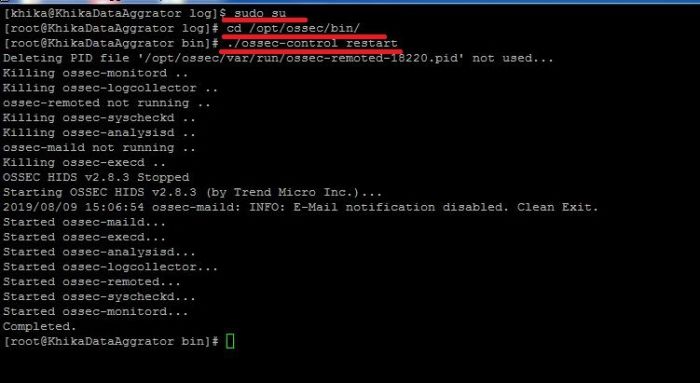
6. cd /opt/ossec/bin
7. ./ossec-control restart

2. If you have logs similar to "ERROR: Authentication key file '/opt/ossec/etc/client.keys' not found." in /opt/ossec/logs/ossec.log.Click here to check Linux ossec agent logs
This means the file client.keys is not available on path "/opt/ossec/etc/"
Resolution:
Please fetch the key for this agent again from KHIKA GUI.Steps to extract key from KHIKA GUI and Import unique key in agent
Restart The Ossec Agent
   1. Do ssh Login as user khika

   2. Set root user using sudo su command

   3. cd /opt/ossec/bin/

      This command will take you to the directory /opt/ossec/bin/)

   4. ./ossec-control restart

3. If you have logs similar to WARN: Process locked. Waiting for permission... in /opt/ossec/logs/ossec.log. Click here to check Linux ossec agent logs
Case I: Wrong IP of Aggregator given while installing the agent.
Resolution:
   1. Go to /opt/ossec/etc directory using following command.

      cd /opt/ossec/etc/

   2. Open the ossec.conf file present in the directory.

      vi ossec.conf

   3. You must give your KHIKA Aggregtor IP in server ip field.

      <server-ip>xxx.xxx.xxx.xxx</server-ip>

   4. Close the editor after saving the changes.

      :wq

   5. Restart The Ossec Agent.

      i.  cd /opt/ossec/bin/

      ii. ./ossec-control restart
Case II: RIDS Mismatch Issue
Resolution:
   1. Go to cd /opt/ossec/etc/

   2. vi internal_options.conf

   3. Check for the following line in this file and set the value to "0"

      remoted.verify_msg_id=0

      Check the following line is set to "1"

      logcollector.remote_commands=1

   4. Close the editor after saving the changes

      :wq

   5. Restart The Ossec Agent.

      i.  cd /opt/ossec/bin/

      ii. ./ossec-control restart

   6. Check if the problem is solved else try following steps:

      1.  Stop ossec server process

      2.  Stop Ossec agent process

         Note : know your agent id by firing command "agent_control -l" in /opt/ossec/bin directory. You will find your agents id by this command.

      3. Ossec Server Side Resolution

         i.   Login to KHIKA Aggregator and type sudo su

         ii.  Go to the directory /opt/ossec/queue/rids/ using "cd /opt/ossec/queue/rids/"

         iii. Delete the file with the name of your agents id. Using following command : rm <agent_id>
      4. Ossec Agent Side Resolution

         i.   Login to your ossec agent and type sudo su

         ii.  Go to the directory /opt/ossec/queue/rids/ using "cd /opt/ossec/queue/rids/"

         iii. type rm -rf * in this directory.

      5.  Start ossec server process

      6. Start Ossec agent process
Ossec Issue on Windows Client Side.
Note: We must install the Ossec agent on windows using Administrator(Local Admin).
1. If you have logs similar to WARN: Process locked. Waiting for permission... in ossec.log.Click here to check Windows ossec agent logs
Resolution:
1. Login to OSSEC Agent and check the file "internal_options.conf" which is present in the directory "C:\Program Files (x86)\ossec-agent" and open it.
2. Check for the following line in this file and set the value to "0" and save it.
remoted.verify_msg_id=0
Check the following line is set to "1"
logcollector.remote_commands=1
3. Restart Ossec Agent
4. Check if the problem is solved else try following steps
1. Stop Ossec Server Process
2. Stop Ossec Agent Process
3. Ossec Server Side Resolution
i. Login to KHIKA Aggregator and type sudo su.
ii. Go to the directory /opt/ossec/queue/rids/ using "cd /opt/ossec/queue/rids/"
iii. Delete the file with the name of your agents id. using rm <agent_id>
4. Ossec Agent Side Resolution
i. Go to the directory "C:\Program Files (x86)\ossec-agent\rids"
ii. Delete the files present in this directory.
5. Start Ossec Server.
6. Start Ossec windows Agent.

Data Collection Issue event if the agent is successfully connected to OSSEC Server.
Centralized configuration is not pushed to ossec agent.
KHIKA Uses a centralized configuration to fetch data from all the devices(windows,linux, etc)
We may need to check if the configuration is pushed at agent side so as to ensure the data collection does not have any issues.
   1. Login to OSSEC SERVER (KHIKA data Aggregator). and become root using command “sudo su”.

   2. Check the information of your agent. using the following steps

      1. Go to directory "/opt/ossec/bin/" using cd /opt/ossec/bin/

      2. ./agent_control -i <agent_id>

         Note: know your agent id by firing command "agent_control -l" in /opt/ossec/bin directory on KHIKA Aggregator. You will find your agent's id by this command.


      3. Note the client version information we got using above command. This md5sum should match with md5sum of centralized configuration file present at KHIKA Aggregator.

      4. Go to directory "/opt/ossec/etc/shared/" using command "cd /opt/ossec/etc/shared/"

      5. Check the md5sum of centralized config file which is agent.conf using command :  md5sum agent.conf


      6. Check If this md5sum matches with the checksum of your agent we noted earlier.

      7. If the md5sum do not match, restart the Ossec Agent And the Ossec Server Process.


Auditing is not enabled on agent.
For windows server devices, KHIKA monitors windows security and system event logs. We must check if proper audit policies are configured at windows server so as to enable logging of events and integrate the events data with KHIKA.
For linux related devices, KHIKA ossec agent fetches data from different types of files such as "/var/log/secure" , "/var/log/messages" , "/var/log/maillog" etc. Please check if Linux server is generating logs on the server itself (i.e. logs are not being forwarded to another server).
If the problem persists, please reinstall the Ossec agent(Make sure you are root while installing on Linux and are administrator while installing on windows device.)
Note: If none of the above cases match your problem or does not solve the issue, Please try to reinstall the ossec agent.
1. Reinstall Windows OSSEC Agent
2. Reinstall Linux OSSEC Agent
Check if the ossec agent belongs to the correct ossec group in ossec.conf
When an ossec based device is added, it gets added to the list of devices that belong to an appropriate ossec group (with name as '<WORKSPACE>_<ADAPTER>_<AGGREGATOR>_<PREFIX>') in ossec.conf configuration file on the ossec server. The OSSEC Group defines the output file in which the logs received from OSSEC Agent are written on the Data Aggregator and parsed for the corresponding Adapter.
If your device(TEST_DEVICE) is added under TEST_WINDOWS workspace and adapter to which it is added is win_ad_ossec_adapter and the adapter runs on node localhost then the ossec group name will as as given below.
TEST_WINDOWS_win_ad_osses_adapter_localhost_0
Next we need to check if the device is added in the group members list as shown below.
To check the configuration of file on ossec server, log on to the KHIKA DATA AGGREGATOR where ossec server is running. Please refer to the screenshot given below:


The record in ossec.conf for the device should be as shown below:
<agent_group><group_name>TEST_WINDOWS_win_ad_osses_adapter_localhost_0</group_name><group_members>TEST_DEVICE</group_members></agent_group>
This configuration will make sure that the logs which are receiving from TEST_DEVICE are getting stored in appropriate location.
In this case the logs for the device TEST_DEVICE will be stored in the directory /opt/ossec/logs/archives/<current_year>/<current_month>/TEST_WINDOWS_win_ad_osses_adapter_localhost_0 directory.
If not, please try restarting OSSEC Services.
Check if profile is configured correctly on OSSEC Agent.
Agents can be grouped together in order to send them unique centralized configuration that is group specific.
We can have different set of configurations for different groups of agents. agent.conf configuration file which is present on the ossec server(KHIKA DATA AGGREGATOR) has a defined configurations for agents which is represented by config_profile.
config_profile Specifies the agent.conf profiles to be used by the agent.
Make sure that your agent is using the correct config_profile for correct configuration.
The config_profile is present in the ossec.conf file on agent.
1. open ossec.conf file on windows agent.
log on to your windows server where ossec agent is installed and do the following to open the ossec.conf file.

2. open ossec.conf file on linux agent.
log on to your linux server where ossec agent is installed and do the following to open the ossec.conf file.
make sure that correct config_profile is added in you ossec agent.
If your device is under windows critical servers group then make sure its ossec.conf file has critical_windows_servers as a config_profile so as to ensure that correct configuration is pushed to the agent.
For example, ossec.conf file on your windows server should be something like this :
   <ossec_config>
       <client>
           <server-ip>x.x.x.x</server-ip>
           <config-profile>windows_critical_servers</config-profile>
       </client>
   </ossec_config>
Failing to Remove Ossec based device.
Time out Error
Check if you are getting following Error while adding the device.

Aggregator is not connected to KHIKA AppServer.
Check if your aggregator is connected to KHIKA server.
   1. Go to node tab in KHIKA GUI.
   2. Click on Check Aggregator Status button as shown in the screenshot below

If it shows that the aggregator is not connected to KHIKA Server, it means that you aggregator is not connected to KHIKA AppServer.Click here to connect aggregator for our khika appserver troubleshooting
How to Find list of ossec agents along with it's status on command line
1. Do ssh login as user "khika” or “root" on KHIKA Aggregator
2. Use following command ( if you login as user khika)
sudo su
3. Go to directory "/opt/ossec/bin"
cd /opt/ossec/bin
4. Use the following command to list all agents added on ossec server (see below screenshot)
./agent_control -l

5. To find only connected agents list use following command
./agent_control -lc
6. To find disconnected agents list use following command
./agent_control -l | grep "Disconnected"
How to check logs in Linux Ossec Agent
1. To check the logs of your ossec agent installed on your linux server for debugging, You must need to go to the following directory:
/opt/ossec/logs
2. Become root user using the command "sudo su"
3. Go the the above mentioned directory using "cd /opt/ossec/logs" command.
4. type " ls -ltrh " to list the files and directories present in the directory.
5. type the following command to check the log file (ossec.log ).
tail -f ossec.log
6. Refer to the screenshot given below:

7. You can also open the file in the vi Editor the check for the issues related to the connection with Ossec Server. For this, you may need to use the following command to open the log file of ossec agent in vi editor:
vi ossec.log
8. This is how you can check the logs of your ossec agent for troubleshooting.
How to check logs in Windows Ossec Agent
1. Open Manage Agent Application which is available in all programs or go to the following path:
C:\Program Files (x86)\ossec-agent
2. Search for win32ui in this directory and open it using Run as Administrator.
3. Please refer to the screenshot given below.

4. This will open a window as given below:

5. Click on the view tab and then click on log to open the ossec agent's log file.
Note: This file is used for debugging the problem related to the connection with ossec server.

6. This operation will open a windows ossec agent log which is used for debugging.
How to check OSSEC Server logs
1. To check the logs of your ossec server which is installed on your KHIKA Aggregator for debugging, You must need to go to the following directory:
/opt/ossec/logs
2. Become root user using the command "sudo su"
3. Go the the above mentioned directory using "cd /opt/ossec/logs" command.
4. Type " ls -ltrh " to list the files and directories present in the directory.
5. Type the following command to check the log file (ossec.log).
tail -f ossec.log
6. Refer to the screenshot given below:

7. You can also open the file in the vi Editor the check for the occurred issues. For this you may need to use the following command to open the log file of ossec server in vi editor:
vi ossec.log
8. This is how you can check the ossec server-side logs.
How to Stop OSSEC Server using command line
1. To Stop the linux OSSEC Server which is preconfigured on your KHIKA Aggregator you will have to go to the following directory:
/opt/ossec/bin
2. Log in to KHIKA Aggregator and become root user using the command "sudo su"
3. Go the the above mentioned directory using "cd /opt/ossec/bin" command.
4. Type " ls -ltrh " to list the files and directories present in the directory.
5. Type following command to restart the ossec agent.
./ossec-control stop
6. Refer to the screenshot given below:

7. Your OSSEC Server is Stopped.
How to Stop OSSEC Agent using command line
1. To Stop the linux OSSEC Agent which is preconfigured on your Device which you want to monitor, you will have to go to the following directory:
/opt/ossec/bin
2. Log in to linux device where ossec agent is installed and become root user using the command "sudo su"
3. Go the the above mentioned directory using "cd /opt/ossec/bin" command.
4. Type " ls -ltrh " to list the files and directories present in the directory.
5. Type following command to restart the ossec agent.
./ossec-control stop
6. Refer to the screenshot given below:
7. Your OSSEC Agent is Stopped.
How to Start OSSEC Server using command line
1. To Start the linux OSSEC Server which is preconfigured on your KHIKA Aggregator you will have to go to the following directory:
/opt/ossec/bin
2. Log in to KHIKA Aggregator and become root user using the command "sudo su"
3. Go the above mentioned directory using "cd /opt/ossec/bin" command.
4. type "ls -ltrh" to list the files and directories present in the directory.
5. type following command to restart the ossec agent.
./ossec-control start
6. Refer to the screenshot given below:

7. Your OSSEC Server is Started.
How to Start OSSEC Agent using command line
1. To Start the linux OSSEC Agent which is preconfigured on your KHIKA Aggregator you will have to go to the following directory:
/opt/ossec/bin
2. Log in to Device where ossec agent is installed and become root user using the command "sudo su"
3. Go the above mentioned directory using "cd /opt/ossec/bin" command.
4. type "ls -ltrh" to list the files and directories present in the directory.
5. type following command to restart the ossec agent.
./ossec-control start
6. Refer to the screenshot given below:
7. Your OSSEC Agent is Started.
How to Restart OSSEC Server
To restart the ossec server, You will have to peform following steps:
1. Login to the KHIKA Appserver GUI using your credentials. 2. Go to the node tab. 3. Click on Reload Configuration button to restart the OSSEC Server. 4. Refer the screenshot given below: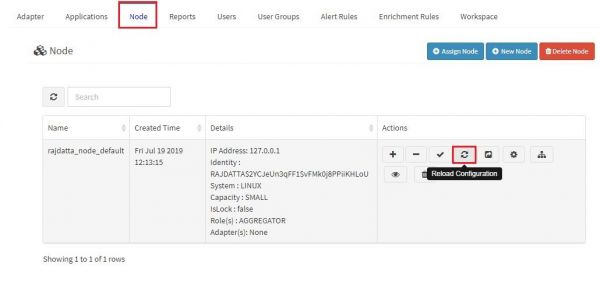
5. When Restart is done you will see a pop-up message similar to what is shown below:
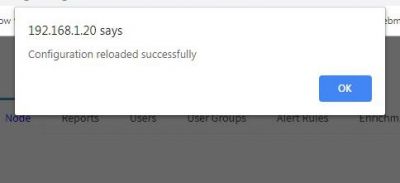
6. This is how you can Restart the OSSEC Server using KHIKA GUI. 7. If you get any error while reloading OSSEC Server, To check if your Aggregator is connected to KHIKA AppServer click here


How to Restart Windows Ossec Agent
1. Open Manage Agent Application which is available in all programs or go to the following path:
C:\Program Files (x86)\ossec-agent
2. Search for win32ui in this directory and open it using Run as Administrator.
3. Please refer to the screenshot given below.
4. This will open a window as given below:
5. Click on Manage tab and then click the restart button to restart the ossec agent.
Note : We must open the Ossec Agent Application using run as administrator.

6. This operation will restart the windows ossec agent.You can refer to the below screenshot.

7. Done
How to Restart Linux Ossec Agent
1. To restart the linux ossec agent installed on your linux you will have to go to the following directory:
/opt/ossec/bin
2. Become root user using the command "sudo su"
3. Go the the above mentioned directory using "cd /opt/ossec/bin" command.
4. Type " ls -ltrh " to list the files and directories present in the directory.
5. Type following command to restart the ossec agent.
./ossec-control restart
6. Refer to the screenshot given below:

7. Your ossec agent is restarted.
How to Reinstall OSSEC Agent for Windows
1. Go to the following path in your windows server:
Control Panel -> All Control Panel Items -> Programs and Features
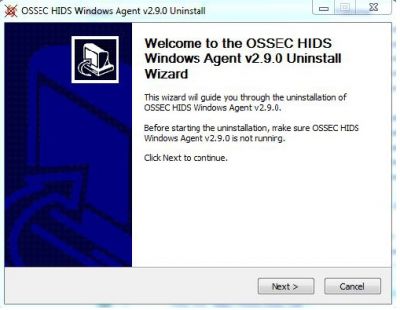
2. Select the OSSEC HIDS Application and then click on uninstall.
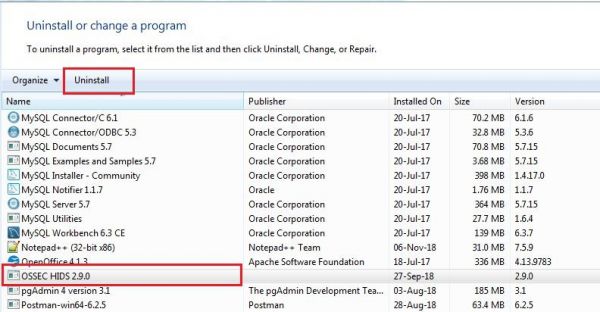
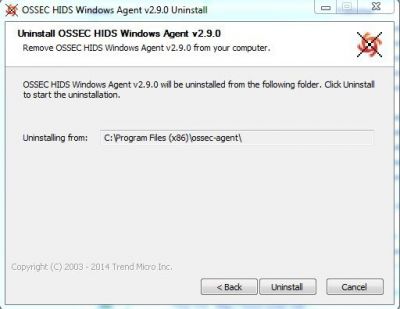
3.Follow the procedure of uninstallation. Please refer to the screenshots below:
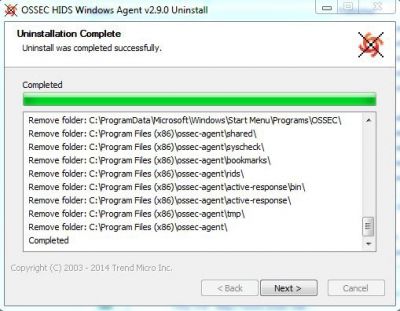
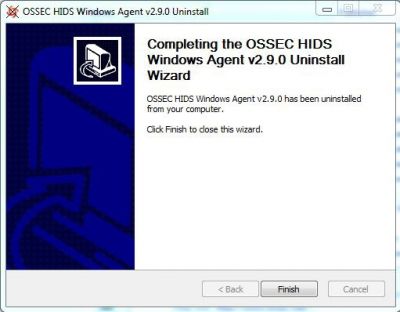
4. Uninstallation of windows ossec agent is Done
5. Now we will install the OSSEC Agent once again.
Note: Please make sure you use an administrator account to install the OSSEC Agent.
6.Install ossec agent for Windows


How to Reinstall OSSEC Agent for Linux
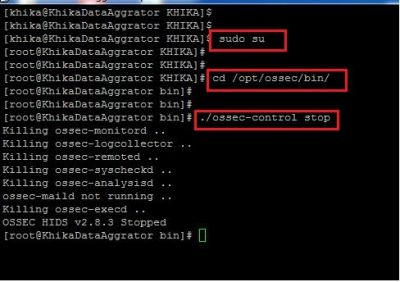
1. To reinstall the ossec agent for linux, We must first uninstall the ossec agent which is already present on your linux server. 2. Login to your Ossec Agent. 3. Fire sudo su command to enter into root. 4. Before proceeding to the uninstallation, make sure you stop the ossec agent. 5. Go to the following directory: 6. /opt/ossec/bin 7. Fire ./ossec-control stop command to stop the agent.
8.
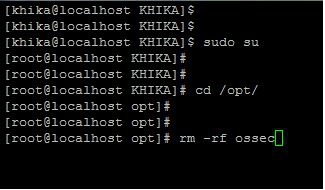
9. Go to the directory where ossec agent gets installed, (/opt) 10. Type following command 11. cd /opt 12. Remove the ossec directory using following command. 13. rm -rf ossec/
14. Now proceed with installing the ossec agent again. 15. Install ossec agent for Linux


KHIKA Disk Management and Issues
In KHIKA there are generally three kinds of partitions
1. root (/) partition which generally contains appserver + data.
2. Data (/data) partition contains index data which include raw data indices, reports and alerts.
3. Cold/Offline data (/offline) partition which is generally NFS mounted partition.
And this type of partition contains offline i.e. archival data which is not searchable.
To find out which partition is full use following commands
   1. df -kh
      above command will give you disk space utilization summary according to partitions.
   2. du -csh * or du -csh /data
      above command will give directory wise space usage summary.
Most probable reasons why Disk is Full
- Size of indexes, representing raw logs grows too much.
- Log files of KHIKA processes does not get deleted (log files of KHIKA processes are huge)
- Postgres database size get increases (when you store too many reports, alerts etc)
- Report's files does not get archived(Reports are CSV and are stored as separate indexes)
- Raw log files does not get archive and deleted for ossec and syslog device(ossec raw files are big, so are syslogs)
- Cold/Offline storage partition gets full or get unmounted(which means, a snapshot of hot data can't happen).
- Elasticsearch snapshot archival utility not working properly (which means, a snapshot of hot data can't happen).
Size of indexes representing raw logs grows too much
The goal is to find the index that eats up maximum space.
Find out from which data source you are getting more logs using a utility like dev tools (you need to be KHIKA Admin to access dev tools)
Use following commands to find out disk space usage accordingly indices
1. GET _cat/indices
Above command will give all indices (see below screenshot). This command will give outputs as index name, size, number of shards, its current status like green, yellow, red, etc.

For example, if you want to find out indices only for FortiGate data source use command like
2. GET _cat/indices/*fortigate*
This command will give only FortiGate data source indices along with its name, status, size, etc. See below screenshot for reference.

If you find that disk space is utilized due to raw indices
1. Make sure that the data retention period (TTL) is reasonable. You can check it by going to "Workspace" settings and modify TTL if required. Go to "Workspace" tab from "Configure" in left menu and modify it if required.
configure -> Modify this workspace -> Data Retention -> Add required data retention ->save
2. Archive some data using snapshot archival utility from this current partition into cold data( kindly refer steps how to configure it). Note that Archival needs space on the cold-data destination.
3. If there is no option to free disk space then delete old large indices.Let say if you want to delete index “alpha-fortigate_firewall_3-raw-fortigate-2019.07.30” then use the following command in dev tools (You must be a KHIKA Admin )
   i.  POST alpha-fortigate_firewall_3-raw-fortigate-2019.07.17/_close
   ii. DELETE alpha-fortigate_firewall_3-raw-fortigate-2019.07.17
Log files of KHIKA processes not deleted
If you found process log files are not getting deleted :
1. Use following command to find out disk usage of log files. Log files stored as *.log extention.
sudo find /opt/KHIKA/ -iname "*.log" -type f | grep -v kafka | xargs du -hs | sort -rh
above command will give the output of filename and it's size (see below screenshot)

2. Use command rm to remove files.
for example, to remove file “/opt/KHIKA/alertserver/log/alertserver_debug_2336.log” use below command.
rm -rf /opt/KHIKA/alertserver/log/alertserver_debug_2336.log
3. Make sure log file clean up cronjob is working (/opt/KHIKA/UTILS/manage_logs.sh)
To check cronjob use following command
# crontab -l, this will give output as follow.

Here, the clean-up cron job is configured every day at 7 am.
4. If any directory entry is missing from clean-up cronjob then add it into "/opt/KHIKA/UTILS/manage_logs.sh"
Steps to add missing entry
   • vi /opt/KHIKA/UTILS/manage_logs.sh
   • Enter in insert mode by pressing “i” on keyboard.
   • Add missing entry. Let say “/opt/KHIKA/collection/log” directory is missing then add it's entry to delete log file which is older than 7 days as follows
     find /opt/KHIKA/collection/log -mtime +7 -delete
   • Press key “Esc” to enter in command mode.
   • Press  key “:wq” to save and exit.

5. On aggregator node make sure following properties is set to "false" in "/opt/KHIKA/collection/bin/Cogniyug.properties" file.
remote.dontdeletefiles = false
Open file opt/KHIKA/collection/bin/Cogniyug.properties using common editor like vi/vim , add property and then save and exit.
If property “remote.dontdeletefiles” is not set to “false”, Aggregator will create .out and .done file in directory “/opt/KHIKA/collection/Collection” and “/opt/KHIKA/collection/MCollection” and will never delete it. This will eat up space on aggregator. Setting property to false will delete the .out and .done files
Postgres database size has increased
Using a utility like du -csh, if you find Postgres data directory(/opt/KHIKA/pgsql/data) is taking more space then find out which table is taking more space using following steps :
1. To execute SQL command, you will need access of PostgreSQL console. To get access of PostgreSQL use following commands in order shown :
   • . /opt/KHIKA/env.sh
   • psql -d khika_db -U khika  -W
   • after entering above command it will prompt for password .Enter the password

2. Use the following SQL command.
SELECT relname as "Table", pg_size_pretty(pg_total_relation_size(relid)) As "Size", pg_size_pretty(pg_total_relation_size(relid) - pg_relation_size(relid)) as "External Size" FROM pg_catalog.pg_statio_user_tables ORDER BY pg_total_relation_size(relid) DESC limit 10;
Above SQL command will return top 10 tables which are occupying the most disk size. Generally but not necessarily, it will return the following tables.
• collection_statistics
• collection_samples
• moving_avg_sigma
• alert_details
• and report related tables
3. Lets say if you found that collection_statistics table is taking more space, then delete data from a table from which is less than the 2018 year's and Use SQL command
delete from collection_statistics where date_hour_str <= '2018-12-31';
OR, if you want to delete from collection_samples table then use the following command
delete from collection_samples where date_string <='2018-12-31';
OR, if you want to delete data from table moving_avg_sigma then use the following command
delete from moving_avg_sigma
OR, if you want to delete data from alert_details table then use the following SQL commands. (Note: it is recommended that keep alerts data at least for three years).For example, delete before the year of 2015 then use following commands
   1. delete from alert_source_device_mapping where alert_id in (select alert_id from alert_details where dtm <=( SELECT EXTRACT(epoch FROM TIMESTAMP '2015-12-31')));

   2. delete from alert_device_mapping where alert_id in (select alert_id from alert_details where dtm <=( SELECT EXTRACT(epoch FROM TIMESTAMP '2015-12-31')));

   3. delete from alert_status_audit where alert_id in (select alert_id from alert_details where dtm <=( SELECT EXTRACT(epoch FROM TIMESTAMP '2018-12-31')));

   4. delete from alert_details where dtm <=( SELECT EXTRACT(epoch FROM TIMESTAMP '2015-12-31'));
NOTE: if you found any other tables which are not in step (2) then contact an administrator.
Report's files not getting archived
Reports CSV files get stored at location "/opt/KHIKA/appserver/reports" and "/opt/KHIKA/eserver/reports" If you found that above mentioned directories are taking more space, then do following steps
1. Make sure the archival cron is configured for reports (/opt/KHIKA/UTILS/manage_logs.sh). Use following command to check
crontab -l
2. Make sure the following entries are present in file /opt/KHIKA/UTILS/manage_logs.sh
   • find /opt/KHIKA/appserver/reports -mtime +7 -type f | xargs gzip

   • find /opt/KHIKA/tserver/reports -mtime +7 -type f | xargs gzip

   • find /opt/KHIKA/eserver/reports -mtime +7 -type f | xargs gzip
If above entry is missing then add it using common editor like vi or vim.
3. If reports are too old and there is no option to free disk space then delete the reports. Use the following commands to delete report files which are older than 1 year
   • find /opt/KHIKA/appserver/reports  -type f -mtime +365 -delete

   • find /opt/KHIKA/tserver/reports  -type f -mtime +365 -delete

   • find /opt/KHIKA/eserver/reports  -type f  -mtime +365 -delete
Raw log files not getting archived and deleted for ossec and syslog devices
On Aggregator node, Raw logs are stored at "/opt/ossec/logs/archives" for Ossec devices and "/opt/remotesyslog" for Syslog devices. On Aggregator by default we keep raw logs only for three days. If you find raw logs more than three days, then delete them and configure cron job for the same. Add following cronjob "/opt/KHIKA/UTILS/manage_rawdata_logs.sh"
Steps to add a cronjob :
1. login as user khika on KHIKA Aggregator server. 2. Enter crontab -e command. 3. Add following entry “* */2 * * * /opt/KHIKA/UTILS/manage_rawdata_logs.sh >/dev/null 2>&1” to run cronjob every 2 hour.4. Press “ESC” key 5. Press key “:wq” to save and exit.


Cold/Offline storage partition gets full or unmounted
If cold/offline storage partition gets full
Every organization keeps cold data according to their data retention policy (1 year, 2 years, 420 days, etc). If there is data which is more than organization policy data retention period then delete it.
To delete data use following command
find location -iname “*.tar.gz”-type f -mtime +days -delete
For example, Let say offline storage location is “/opt/KHIKA/Data/offline” and the retention period is 420 days then use the following command to delete data.
find /opt/KHIKA/Data/offline/ -iname “*.tar.gz” -type f -mtime +420 -delete
The cold data is typically stored on cheaper storage and is mounted using NFS. Sometimes, nfs storage partition gets unmounted
1. If you know the NFS server and its shared location then refer the following command to mount it again
mount -t nfs 192.168.0.100:/nfsshare /mnt/nfsshare
where "192.168.0.100" is nsf server and "/nfsshare" is share location and "/mnt/nfsshare" is mount point.
2. Contact server administrator to mount offline storage
Elasticsearch snapshot utility not working properly
Elasticsearch Snapshot utility raises an alert when it fails to snapshot.
Alert status is "archival_process_stuck"
Alert status message "archival_process_stuck" indicates that the process is taking more than 24 hours for a single bucket. This may happen due to a script terminated abnormally or compression operation taking more time. Check logs to find the issue. Find the current state of recent archival and change it accordingly. To change the current state of archival you will need PostgreSQL access use following command
   To get access of PostgreSQL

   1. . /opt/KHIKA/env.sh
   2. psql -d khika_db -U khika  -W


   3. After entering above command it will prompt for password .Enter the password.
1. If archival bucket state is "COMPRESSING", "COMPRESSING_FAILED", then make its state as "SUCCESS" use following SQL command
NOTE: Before updating Find out required id of the record in table use following SQL command
1. select id from application_transformerarchivalaudit where status in ('COMPRESSED' ,'COMPRESS_FILE_MOVE_FAILED')
Above command will return id, use this in next subsequent command. Let say command return id as 1.
2. update application_transformerarchivalaudit set status='SUCCESS' where id =1
2. If archival bucket state is "COMPRESSED", "MOVING_COMPRESSED_FILE" or "COMPRESS_FILE_MOVE_FAILED" then move archival to offline storage (if available ) and update it's state to "COMPLETED"
NOTE: Before updating Find out required id of the record in table use following SQL command
1. select id from application_transformerarchivalaudit where status in ('COMPRESSED','MOVING_COMPRESSED_FILE','COMPRESS_FILE_MOVE_FAILED')
Above command will return id and use this in next subsequent command. Let say command return id as 1.
2. update application_transformerarchivalaudit set status='COMPLETED' , repo_path="location_where_archival_move" where id =1
In above command "location_where_archival_move” is an offline storage path where archival is manually move.
For example, If you move archival “/opt/SNAPSHOT/ALPHA/2019/Jul/WINDOW_5/20190730.tar.gz" to offline storage /opt/ES_BACKUP/ALPHA/2019/Jul/WINDOW_5/20190730.tar.gz" then location_where_archival_move will be “/opt/ES_BACKUP/ALPHA/2019/Jul/WINDOW_5/20190730.tar.gz”
3. If the archival state in "RESTORE_ARCHVAL_COPYING", "RESTORE_ARCHIVAL_COPY_FAILED", "RESTORE_ARCHIVAL_READY_TO_DECOMPRESS", "RESTORE_ARCHIVAL_DECOMPRESSING", "RESTORE_ARCHIVAL_DECOMPRESS_FAILED" then try to reschedule restore snapshot by making it's state to "RESTORE_ARCHVAL_SCHDULED"
NOTE: Before updating Find out required id of the record in table use following SQL command.
1. select id from application_transformerarchivalaudit where status in ('RESTORE_ARCHVAL_COPYING','RESTORE_ARCHIVAL_COPY_FAILED,'RESTORE_ARCHIVAL_READY_TO_DECOMPRESS','RESTORE_ARCHIVAL_DECOMPRESSING','RESTORE_ARCHIVAL_DECOMPRESS_FAILED')
Above command will return id and use this in next subsequent command. Let say command return id as 1.
2. update application_transformerarchivalaudit set status='RESTORE_ARCHVAL_SCHDULED' where id =1
4. If the archival state is "RESTORE_ARCHIVAL_FAILED" then try to reschedule "RESTORE_ARCHVAL_SCHDULED" if again it gets failed then make it's state as "RESTORE_ARCHIVAL_NOT_AVAILABLE".
NOTE: Before updating Find out required id of the record in table use following SQL command.
1. select id from application_transformerarchivalaudit where status in ('RESTORE_ARCHIVAL_FAILED')
Above command will return id and use this in next subsequent command. Let say command return id as 1.
   2. update application_transformerarchivalaudit set status='RESTORE_ARCHVAL_SCHDULED' where id =1
      OR
      update application_transformerarchivalaudit set status='RESTORE_ARCHIVAL_NOT_AVAILABLE' where id =1
alert status is "archival_failed"
If the alert status is "archival_failed" and event is "archival process failed reach max retries".It means that snapshot archival process reached maximum retries and hence it will not launch the next snapshot. Please check the logs.
1. If snapshot archival failed due to connection error make its state as "SCHEDULED"
1. select id from application_transformerarchivalaudit where status in ('FAILED')
Above command will return id and use this in next subsequent command. Let say command return id as 1.
2. update application_transformerarchivalaudit set status='SCHEDULED' where id =1
2. If snapshot get failed due to shards failed then make its state as "SCHEDULED" and after rescheduling snapshot again if it gets failed then either delete bucket entry from a table or make its state as INDEX_NOT_FOUND
1. select id from application_transformerarchivalaudit where status in ('FAILED')
Above command will return id and use this in next subsequent command. Let say command return id as 1.
   2. update application_transformerarchivalaudit set status='SCHEDULED' where id =1
      OR
      update application_transformerarchivalaudit set status='INDEX_NOT_FOUND' where id =1
      OR
      delete from application_transformerarchivalaudit where id=1
Elasticsearch Snapshot functionality configuration
Elastisearch snapshot functionality is nothing but data archival functionality.
Configuration: To setup snapshot /restore functionality you need to configure following things
- ElasticSearchSnapshotRestoreUtils.sh
- EsArchivalCron.sh
- TLHookCat.py
- elasticsearch_archival_process_failed alert
Configuration of ElasticSearchSnapshotRestoreUtils.sh
Functionality of ElasticSearchSnapshotRestoreUtils.sh is to take snapshot according to the “Time to Live” ( TTL ) setting of the workspace and restore the snapshot as and when necessary.
To configure “ElasticSearchSnapshotRestoreUtils.sh” you need to set the following properties
1. path.repo
Need to put this property in elasticsearch configuration file “/opt/KHIKA/elasticsearch/config/elasticsearch.yml”
Use a common editor like vim/vi to edit the configuration file (see below screenshot)

here path.repo is “/opt/KHIKA/Data/offline”
Please Note: If you have configured a multi-node cluster, then the property path.repo should be same on all nodes or this file should exist on a shared location accessible to all the nodes.
Please Note: After configuration of path.repo property in elasticsearch.yml then please
restart all elasticsearch node which is within cluster.
2. snapshot_base_repo_path
Need to put property ‘snapshot_base_repo_path’ in “/opt/KHIKA/Cogniyug.ini” file. The value of this property should same as ‘path.repo’ set in elasticsearch.yml file in step 1.
Use an editor like vi/vim to set the property (see below screenshot)

3.delete_index_after_snapshot
Need to put this property in “/opt/KHIKA/Cogniyug.ini” file.
This property tells whether to delete indices after taking a snapshot. If the value of delete_index_after_snapshot=yes then it will delete index after the snapshot is stored in snapshot_base_repo_path. If the value of delete_index_after_snapshot=no then it will not delete the index.
Edit the file like shown below in the screenshot

After configuration above properties (1,2 &3 ) Please configure cronjob for script ElasticSearchSnapshotRestoreUtils.sh. Add following entry in cronjob
*/15 * * * * /opt/KHIKA/UTILS/ESTools/ElasticSearchSnapshotRestoreUtils.sh >> /opt/KHIKA/UTILS/ESTools/Cron_ElasticSearchSnapshotRestoreUtils.log 2>&1
Follow below steps to add a cronjob
   1. login as user khika on server.
   2. Use command crontab -e
   3. Enter key “i”  for insert mode
   4. Add below entry( See screenshot )


      here cronjob scheduled for every fifteen minutes
   5. press key “:”+”w”+”q” to save and exit (same as your would save file in vi editor)
Configuration of EsArchivalCron.sh
The functionality of EsArchivalCron.sh is
1. Compressing the snapshot taken in the above step.
2. Move the compressed snapshot to offline/cold storage if it is provided.
3. Check the integrity of archival on a daily basis.
To configure EsArchivalCron.sh need following properties
1. archival_loc (optional)
This is an optional property
If you want to move archival snapshots to some other offline/cold storage then use this property.
If you don’t want to move archival snapshot to some other storage then don’t add this archival_loc property.
This property should be added in section ELASTICSERVER of “/opt/KHIKA/Cogniyug.ini” file (See below screenshot)

Here archival_loc is set to /opt/ES_BACKUP
After configuration of the above optional property please add the following cronjob
*/10 * * * * /opt/KHIKA/UTILS/ESTools/EsArchivalCron.sh >> /opt/KHIKA/UTILS/ESTools/Cron_EsArchivalCron.log 2>&1
See the following steps to add a cronjob
   1. Login as user khika on server

   2. Use command crontab -e

   3. Enter key “i”  for insert mode.

   4. Add below entry (See below screenshot)


      here cronjob scheduled for every ten minutes.

   5. Press key “:”+”w”+”q” to save and exit (just like saving and quitting vi editor)

TLHookCat.py
You will need to configure TLHookCat.py to consume KHIKA formatted logs. This KHIKA formatted logs generated by EsArchivalCron.sh and ElasticSearchSnapshotRestoreUtils.sh utility. This logs are necessary to generate an alert if something goes wrong with Snapshot and Restore functionality.
Configure adapter script “/opt/KHIKA/Apps/Adapters/TLHookCat/TLHookCat.py” inside SYSTEM_MANAGEMENT Workspace
(Please refer Working with KHIKA Adapters to configure custom adapter)
After configuration of a TLHookCat.py please add the following entry in its configuration file which is located at “/opt/KHIKA/Apps/Adapters/TLHookCat/” and filename will be “config_SYSTEM_MANAGEMENT_<Adapter name >_LOCALHOST.csv”
(here <Adapter name> is the name of adapter that you added while doing customer adapter configuration)
Entry to add in configuration file config_SYSTEM_MANAGEMENT_<Adapter name >_LOCALHOST.csv
/opt/KHIKA/UTILS/ESTools,2.*.log$,NONE,NONE
elasticsearch_archival_process_failed alert
This is an alert rule which raise an alert if something goes wrong with elasticsearch snapshot functionality. This alert is already configured just check whether it is active or not to check please follow below steps and go to
configure -> Alert Rules -> select elasticsearch_archival_process_failed -> Modify ->Select Active checkbox -> Submit
Check Status of Snapshot / Restore Functionality
On KHIKA web console you will able to check status of Snapshots.Please go to
Configure -> Workspace -> Archival Status Audit -> Select Date Range -> Run
After following above steps you will see snapshot status within a selected date range (see below screenshot)

Above the screenshot, you will see the following columns
1. Directory
This show bucket date i.e index day that has been considered for Snapshot.
2. Last Updated Date
This shows last updated time to it’s corresponding state .
3. Checksum Base-Line Date
This shows the checksum baseline date of archival. When snapshot completed through its archival cycle then it’s checksum will be calculated. This help to identify data tampering (if someone tries to modify archival )
4. Checksum Modified Date
If baseline checksum modified then this column shows a date of modification.
5. Checksum Details
This column shows baseline checksum (old checksum) and new checksum (if checksum modified).
6. Restore Snapshot
This column shows action for the user if want to restore snapshot or cancel schedule for a restored snapshot.
7. Archival Status
This column shows the current status of the snapshot/bucket. Please see the following status of the snapshot
restore process (point a and point b)
Snapshot status
While taking snapshot there are some intermediate state which is given below.
NOTE: If there are any jobs with status “RESTORE_ARCHVAL_SCHDULED” Then script will give priority for restoration of the snapshot. User has to wait until all restored archival job to be finished.
1. SCHEDULED
SCHEDULED status means snapshot has been scheduled for that particular date.
2. INDEX_NOT_FOUND
Before scheduling snapshot utility check for index availability on that particular bucket day/date (according to TTL of the workspace). If index not found for that particular bucket day/date then it’s status mark as INDEX_NOT_FOUND.
3. IN_PROGRESS
This state means elastic snapshot is currently running.
4. SUCCESS
SUCCESS means snapshot finished and all shards were stored successfully.
5. FAILED
The snapshot finished with an error and failed to store any data.
6. COMPRESSING
After SUCCESS state of the snapshot, the COMPRESSING state comes into the picture. This state usually takes a long time for compressing.
7. COMPRESSED
After state COMPRESSING into the state will be COMPRESSED. It means that snapshot compressing done successfully.
8. COMPRESSING_FAILED
If something goes wrong while doing COMPRESSING snapshot then it states mark as COMPRESSING_FAILED.
9. MOVING_COMPRESSED_FILE
After state COMPRESSED if the user has configured to move archival snapshot to some offline/cold storage then it state MOVING_COMPRESSED_FILE appear while moving.
10. COMPRESSE_FILE_MOVED
Snapshot archival file move successfully to offline/cold storage.
11. COMPRESS_FILE_MOVE_FAILED
Failed to move COMPRESSED snapshot to offline/cold storage.
12. CHECKING_INTEGRITY
Checking integrity of snapshot archival. Here md5 checksum is calculated for archival.
13. CHECK_INTEGRITY_FAILED
This state means something goes wrong while calculating md5 checksum.
14. COMPLETED
After calculating md5 checksum successfully snapshot archival state mark as COMPLETED. This means the snapshot archival cycle has been completed.
Restore Snapshot status
There are some intermediate state while doing restoration of the snapshot which is given below.
If there currently any snapshot is running then the script will wait for to finish it and then restoration process will begin
1. RESTORE_ARCHIVAL_SCHDULED
This state means archival snapshot has been scheduled for restoration.
2. RESTORE_ARCHIVAL_NOT_AVAILABLE
This state means that snapshot archival not available on the designated location. This state specifies there is no way to restore the snapshot.
3. RESTORE_ARCHIVAL_COPYING
This RESTORE_ARCHIVAL_COPYING state means archival snapshot file is copying from offline/cold storage to registered snapshot repository location.
4. RESTORE_ARCHIVAL_COPY_FAILED
This state means failed to copy snapshot archival file from offline/cold storage to registered repository location.
5. RESTORE_ARCHIVAL_READY_TO_DECOMPRESS
This state means the snapshot archival file successfully copied from offline/cold storage to registered snapshot repository location.
6.RESTORE_ARCHIVAL_DECOMPRESSING
This state show that snapshot archival file is decompressing.
7. RESTORE_ARCHIVAL_DECOMPRESS_FAILED
This state means failed to decompress snapshot archival file. This may happen due to corrupt snapshot archival filename .
8.RESTORE_ARCHIVAL_INIT
RESTORE_ARCHIVAL_INIT snapshot restoration is in INIT state but not started.
10.RESTORE_ARCHIVAL_INDEX
This state means Reading index meta-data and copying bytes from source to destination.
11.RESTORE_ARCHIVAL_START
Restoration of the snapshot has been started.
12. RESTORE_ARCHIVAL_FINALIZE
Restoration has been done and doing some cleanup.
13. RESTORE_ARCHIVAL_DONE
Restoration of snapshot completed and data available to the user for searching and aggregation.
What to do if something goes wrong for snapshot restore functionality
Elasticsearch Snapshot utility raises an alert when it fails to take a snapshot. For problems related to snapshot restore functionality please check here.
Alerts in KHIKA
What to do when an alert is triggered
We have resolutions written for each rule and it gives the possible action that should be taken by the concern team. Refer the following screenshots.


How to provide access to alerts for a workspace to User?
For a given workspace, alerts can be viewed only by the users who are part of the User Group associated with the workspace. Hence to grant a User access to alerts, the User needs to be added to the User Group associated with the Workspace.
What to do alerts are not visible on the Alert Dashboard despite alert getting raised or alert emails being received?
Alerts are not visible on the Alert Dashboard mainly due to following reasons:
- Database connection error
- Alert Adapter PID file is empty/corrupt
- AnomalyEngine process is not running
To address the above issues, please proceed as mentioned below:
Database connection error - In case of this error, the Alert Adapter fails to push the alerts into Postgres database due to connection issue caused by incorrect database configuration. This error can be fixed by correcting the database configuration on all the KHIKA nodes where alert adapter is running. To find out the list of nodes on which alert adapter is running,
   i) Go to Configure   ---> Select Adapter  Tab ---> Select “SYSTEM_MANAGEMENT” Workspace. Search for “PushAlertToDB”  in  search bar
   ii) Find out list of host in “Details”   columns of adapter tab (see below screenshot for reference)

iii)Do ssh login on nodes which found in steps and open the "/opt/KHIKA/Cogniyug.ini" file.

iv) Verify the database configuration in the "PG_DATABASE" section and correct any necessary parameter.

v) Save the "/opt/KHIKA/Cogniyug.ini" file.
Alert Adapter PID file is empty/corrupt - In case of this error, the Alert Adapter PID file is malformed. This error can be fixed by removing the PID files on all the KHIKA nodes where alert adapter is running. To find out the list of nodes on which alert adapter is running,
i) Go to Configure ---> Select Adapter Tab ---> Select “SYSTEM_MANAGEMENT” Workspace. Search for “PushAlertToDB” in search bar.
   ii) Find out list of host in “Details” columns of adapter tab (see below screenshot for reference).
   iii)Do ssh login on nodes which found in steps and go to the "/opt/KHIKA/UTILS/AlertAdapter" directory.
   iv) Remove the "/opt/KHIKA/push_alert.pid" file.

AnomalyEngine process is not running - In case of this error, the customer's AnomalyEngine process is not running. To resolve this problem, the AnomalyEngine process needs to be restarted. To find out the list of nodes on which AnomalyEngine is running,
i) Go to Configure ---> Select Node Tab ---> Select “SYSTEM_MANAGEMENT” Workspace. Search for “AnomalyEngine” in search bar.

ii)Do ssh login on nodes which found in steps and run the "/opt/KHIKA/UTILS/restart_anomaly_engine.sh" script.

What to do if alerts are not receiving through emails for a particular alert?
1. Login into KHIKA UI and navigate to Configure -> Alert Rules
2. Search for the alert name for which you want to enable the alerting.

3. Click on the Modify Rule option in the Actions column.

4. Cilck on the dropdown menu front of "Email" and select "Active" option.
5. Add email Ids in the Text box and click on the "submit" button.
.png)
Email is configured for an alert but not receiving the emails for the alert.
Please check if the SMTP settings are correct or if any network activity was done which can prevent the SMTP service from sending emails. SMTP Server Settings can be checked via SMTP Server Settings
How to disable / Enable the alert?
1. Login into KHIKA UI and nevigate to Configure -> Alert Rules
2. Search for the alert name for which you want to enable the alerting.
3. Click on the Modify Rule option in the Actions column.

4. Untick / Tick the check box and click on the submit button.
.png)
Can we write new alert rules?
Yes, you can create basic alerts using the KHIKA UI click here to understand steps of creating Alerts in KHIKA.
Reduce Noisy alerts/suppression for an alerts
Sometimes it happens that user may get the same type of alert for the number of times. To reduce these alerts frequency KHIKA provides alerts suppression functionality Following are the steps to configure alert suppression
1. Login to KHIKA Web-Console
2. Goto Configure - Alerts
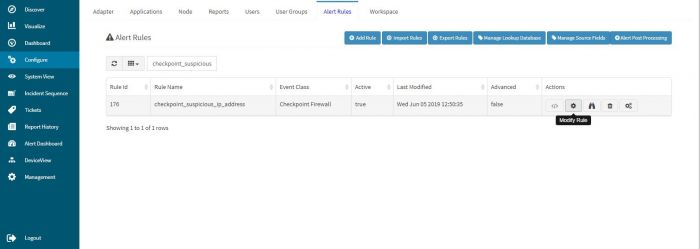
3. Search for require alert in a list and then click on modify button (see below screenshot)
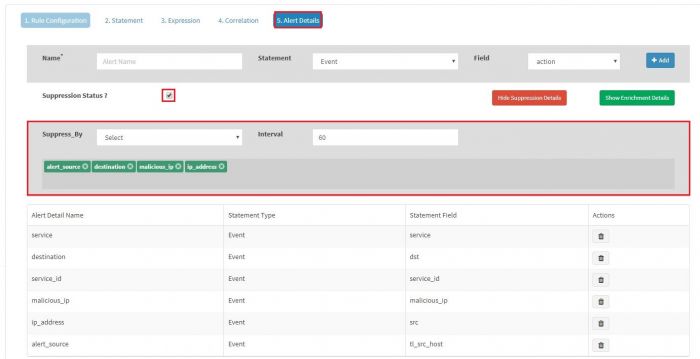
 4. Goto Alert Details tab
5. Click on "Show Suppression Details"
6. From "Suppress_by" Dropdown select required fields for alert suppression
7. Insert suppression time in minute (default 60 min)
8. Click on Submit to save (see below screenshot)
4. Goto Alert Details tab
5. Click on "Show Suppression Details"
6. From "Suppress_by" Dropdown select required fields for alert suppression
7. Insert suppression time in minute (default 60 min)
8. Click on Submit to save (see below screenshot)


Alert is not wanted for a particular device or user ( whitelisting/blacklisting of alert)
For whitelisting of an alert required lookup database. User refers to this database to do whitelisting or blacklisting of an alert. lookup database is a CSV file.
Following are the steps of alert whitelisting
1. Please upload the required CSV file. if already uploaded then ignore this step
Click here for Data Enrichment.
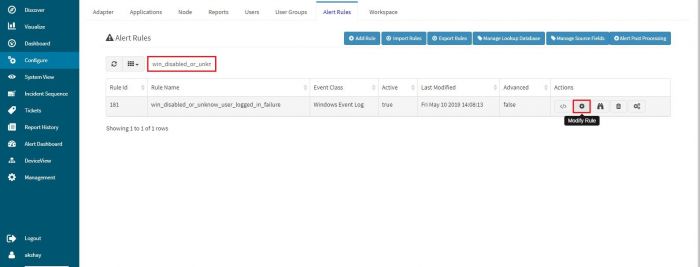
2. Goto configure -> Alert Rules
3. Search for required alert
4. Click on modify button (see below screenshot)
 \
5. Goto "Expression" tab
6. Select required field for comparision with whitelisting database
7. Tick on "Is Lookup"
8. Select required lookup database from "Enrichment Lookup" dropdown
9. Select comparable lookup database field from "Enrichment Column" dropdown
10. Select required comparision operator from "Evaluation Type" dropdown
For whitelisting select "is null" operator
For blacklisting select "is not null" operator
11. Click on "Add" button
12. click on "Submit" button
\
5. Goto "Expression" tab
6. Select required field for comparision with whitelisting database
7. Tick on "Is Lookup"
8. Select required lookup database from "Enrichment Lookup" dropdown
9. Select comparable lookup database field from "Enrichment Column" dropdown
10. Select required comparision operator from "Evaluation Type" dropdown
For whitelisting select "is null" operator
For blacklisting select "is not null" operator
11. Click on "Add" button
12. click on "Submit" button
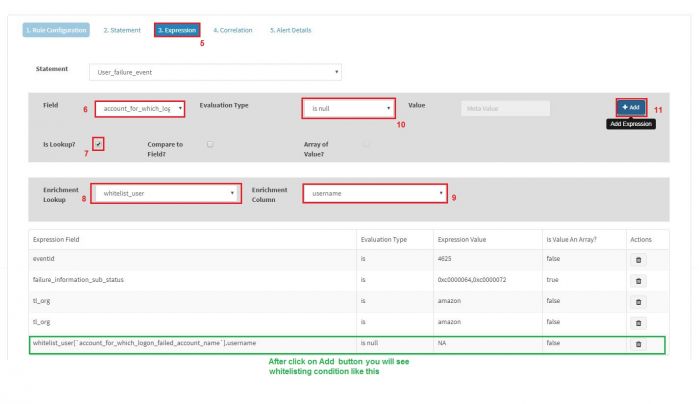

Configure Alert Analysis
Following are the steps to configure the alert analysis
   1. Login to KHIKA web-console
   2.  Goto configure -> Alert Rules
   3. Search for require alert in the list
   4. Click on modify button.
   5. Select the required group by fields one by one for alert  analysis from "Alert Fields" dropdown
   6. Tick on "Multi Value" field if a selected field contains a comma (,) separated values
   7. Click on Add button
   8. Click on Submit button
      Please check the following screenshot for steps 5 to 8
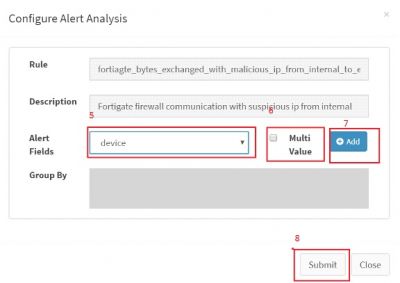

Please Note: to check alert analysis on the alert dashboard it is necessary to configure script "runAlertAnasysis.sh" which is located at "/opt/KHIKA/UTILS/AlertAnalyzer". Configure this script in SYSTEM_MANAGEMENT Workspace of KHIKA Customer. For this kindly refer user guide to check how to add a custom adapter Adding Adapters
Why are we getting "Device not sending any data" alert ?
The reason for this alert Data is not coming into KHIKA for that device.
Resolution -
Ossec Related Devices
Please follow below steps:
   1. Check Data is coming in KHIKA aggregator on directory "/opt/ossec/logs/archives/Year/Month/WorkspaceName_adaptername_nodename".

      Example:

      • Workplace Name in which device is added  - WINDOWS_AD

      • Adapter name for which device is added - win_ad_osses_adapter

      • Node name in which device is added  - techlineage_dell_node_default

      • Current Year is  - 2019

      • Current Month is - August

      • SSH to the KHIKA Aggregator and switch over to superuser via the command 'sudo su'.
      • Then Go to the directory  "/opt/ossec/logs/archives/2019/Aug/WINDOWS_AD_win_ad_osses_adapter_techlineage_node_default_0" using command "cd /opt/ossec/logs/archives/2019/Aug/WINDOWS_AD_win_ad_osses_adapter_techlineage_node_default_0"

   2. Enter command "ls -lr" .
       Now you see log files in format "ossec-archive-Day.log" .Check current time log file is generated and data is coming into it.

       Example:  Suppose current date is 21st August and time is 11:30, then there is file with name ossec-archive-21.log. So check logs are coming or not.
   3. If data is not coming in the above path. Then there are below reasons.
      a.  Ossec Agent And Ossec Server Connection issue

      b.  Data Collection Issue even if the agent is successfully connected to OSSEC Server

      c. KHIKA aggregator is not connected to KHIKA Appserver. Click here to check status of KHIKA Aggregator i.e. Node

    4. If data is coming on log file path then check data on discover page.

      a. If Eserver not indexing data due to mapping related error,Click  here.

      b. If Parsing Error is occured please check  here.
Syslog Devices
Please follow below steps:
   1. Check Data is coming in KHIKA aggregator on directory "/opt/remotesyslog/device_ip".

     "cd /opt/remotesyslog/device_ip"
   2. Enter command "ls -lr" .Now you see log files in format "Year-Moth-Date-hour.log" .Check current time log file is genereated and data is coming into it.

      Example: Suppose current date is 21st August and time is 11:30, then there is file with name 2019-08-21-12.log. So check logs are coming or not.

   3. If data is not coming in the above path. Then there are below reasons

      a. check here if data is not receiving on Syslog Server

      b. KHIKA aggregator is not connceted to KHIKA Appserver
      Click here to check status of KHIKA Aggregator i.e. Node

      If data is coming on log file path then check data on discover page.

      a. If Eserver not indexing data due to mapping related error,Click  here.

      b. If Parsing Error is occured please check  here.
How to use search string while searching the data in KHIKA
Data cannot be searched in KHIKA
Resolution:
Case 1. Check that you have selected appropriate index
Befor sumbmitting search string make sure you select a appropriate index pattern in Discover tab. Click here to check how to change index pattern in Discover tab and click here to know more about index pattern

As in the above example, we are searching for windows related data in the FortiGate firewall index, so we are not getting any data. We have to search the data in appropriate index pattern like raw-win-ev* for searching windows server related data.
Case 2. Check that search string you are using is correct
The search queries of KHIKA are based on Lucene query syntax.
To search for a range of values, you can use the bracketed range syntax, [START_VALUE TO END_VALUE].
Example, to find entries that have event_id as 4625, you could enter event_id:4625 The ‘colon’ (‘:’) character is treated as equal-to (‘=’).

To specify more complex search criteria, you can use the Boolean operators AND, OR, and NOT.
Searching of data is in-memory operation and requires to compute hence we may need to write the search string precisely to get the required data.
case 3. Specific data is not present for a particular time or time range is incorrect
Sometimes it is also possible that specific logs are not coming into KHIKA.So no data found after searching for that data.
Sometimes the user may select an incorrect time range to search the required data. Select the appropriate time range from DateTime picker of Discover Page.

Data insert in elasticsearch index using ESERVER process. Sometime ESERVER not able to insert data in the index due to the incorrect data type of field.
For example, Field “bytes” is set to integer but raw data “bytes” field contains string value ”-” so in this case eserver won’t be able to insert data for that particular line.
How to find which field causing an error while indexing data
(suppose you are searching data for customer ALPHA )
a. Find out required process id of eserver to check log file (See the following screenshot)
In above screenshot ps -ef | grep eserver | grep alpha is a command to find out process id of eserver process for customer alpha. If command does not return output like above then it means that process is not running Kindly launch eserver process from node tab of configure page Where “12698” is a process id
b. Goto directory “/opt/KHIKA/eserver/log”
c. Search for file jserver_debug_<proccess_id>.log Where <process_id> : id which is found in step (a)
d. Use the following command to find out mapping related error grep “mapper_parsing_exception” jserver_debug_2524.log (see the following screenshot)above screenshot shows mapping related error. Here field mapping exception is number_format_exception(3) and field causing that exception is devid.
e. Open the log file and search for “consumer.ElasticProcessor:293” just after the above error. Which found in step (d). This search will tell workspace which causing mapping related error. See the following screenshot for reference.
Here Workspace is “FORTIGATE_FIREWALL_3” for which mapping related error occurred.
f. Find data sources which belong to workspace found in step (e)
You will get a list of different data sources on Discover Page of KHIKA Web-console.
Check index-patterns which belong to the workspace which found in step (e). See the following screenshot.
Here data source is “FortiGate” (string after *-raw-* ) for FORTIGATE_FIREWALL_3 workspace.
g. Update data type field which causes an error. field found step (d) i. Goto configure -> Alert Rules -> Manage Source Field (see the following screenshot)ii. Click on “Update Source Key” of required data source which found in step (f).
iii. Search for a required field which found in step (d) iv. Click on “Modify Key Meta” v. Select required field type from “field type” drop-down. vi. Click on the “Update” button. vii. Click on “Submit” button to save and exit. See the following screenshot for steps from (iii) to (vii)
NOTE: After modifying data type of field, effect will take only for newly created indices not for existing one.


Case 5: Parsing Error
Adapter normalizes raw logs into KHIKA log format. Sometimes it happens that logging format of data source may get changed due to this, adapter not able to parse the raw logs.
In this case, Adapter gives a parsing error.
To resolve this kind of error please check logs of an adapter and try to investigate lines which causes a parsing error.
To locate logs file and adapter file do the following steps
   a. Go to Configure -> Adapter

   b. Select required workspace

   c. Find out the location of an adapter which is given in Command on adapter tab Details columns

   d. Check node i.e. Aggregator
      See the following screenshot for steps (a) to (d)


   e. Do ssh login on aggregator which found in step (d)

   f.  go to the location which found in step  (c). See below screenshot

   g. check log file with starting name like either log_*.log or hook_log_*.log
      Typical log file format is  log_<WORKSPACE_NAME>_<ADAPTER_NAME>_<AGGREGATOR_NAME>.log

   h. open logs file and check for error and try to investigate lines which cause an error.
      See the following screenshot  from step (f) to (h)
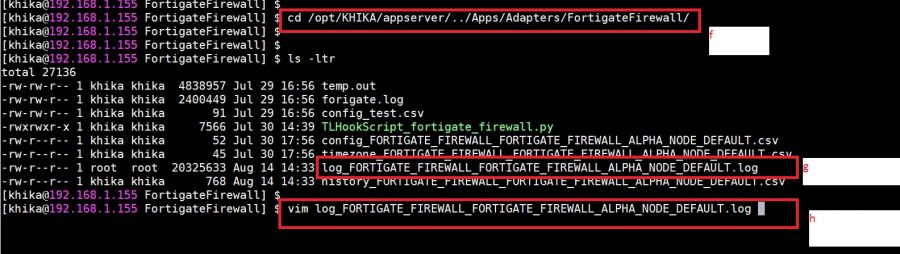


Case 6: Raw logs not coming
Sometimes it happens that raw logs are not received from the device due to some connectivity issue between device and KHIKA aggregator. Raw logs may either be received via Syslog protocol or via Ossec Server.
For Syslog Devices
If raw logs are to be received from Syslog kindly check logs on aggregator at location “/opt/remotesyslog/” and locate device IP directory. Inside device ip directory find out the file name of the current date. If the current date file is not present then it means that the device is not sending data. see the following screenshot

For Ossec Devices
If logs coming from Ossec Server, go to the location “/opt/ossec/logs/archives/” on aggregator and find out the list of files which is associated with workspace name.
If the log file is empty or device you trying to search is not found then it means logs are not coming.
Typical Ossec log file format is archives_<WORKSPACE_NAME>_<ADAPTER_NAME>_<NODE_NAME>_*.log.See the following screenshot

For resolution please refer here
Case 7: Configured Device has incorrect time
Sometimes it happens that configured device especially network device has incorrect time. Report such device with the respective owner.To find out such a device.
   a. Goto location “/opt/remotesyslog/” on the aggregator.
   b. Find out file having modified date is a current date but the file name is not  <current date>.log

      In the above screenshot yellow mark file “20200812.log” not in correct time and device ip is 192.168.1.102

Error while searching
Discover:Error:invalid cookie

Resolution :
This error occurs when you session is time out. So refresh page and login into KHIKA and then search again.
Error :Request time out
Resolution :
Searching is an in-memory operation and requires high compute.
While searching the data we must know on which data source we are firing the search, if the data source is a high data producer then the amount of data on which the search is applied is huge and hence results in a high compute operation.
Firing a generalized search on such huge data for bigger date range may cause the failure of the elastic search process as it gets out of memory.
We must create our search string and appropriate date range precisely to search the data to avoid this problem.
Reports in KHIKA
Report CSV file is not generated?
Resolution:
Case 1. Required data for report is not Present
There might be some cases where reports will not have required data to run hence check if the required data is present for the requested report.
To check report related data is present or not. Use the report search string and search in the raw index for data.


Run the report manually From UI for Specific date range for which report CSV was not generated.
Now Check report status and download report CSV from Report history tab.
You can also check report CSV from the backend. Please follow the below steps
   1. Login into KHIKA Appserver.
   2. Go to directory /opt/KHIKA/eserver/reports using command “cd /opt/KHIKA/eserver/reports”
   3. Enter Command “ls - ltr”
   4. Go to the directory name in the format workspacename_workpspace_id for which you ran the report.“cd  workspacename_workpspaceid “
      Eg. For “Windows_AD” workspace you see the directory like “WINDWOS_AD_7”
   5. Enter the command “ls -ltr reportaname*”

      Now you can see the report CSV is generated on not for last ran report.

      Eg . ls -ltr winev_local_logon_failures*
   6. Check data is present in generated report csv by using command “cat report_csv_filename”.
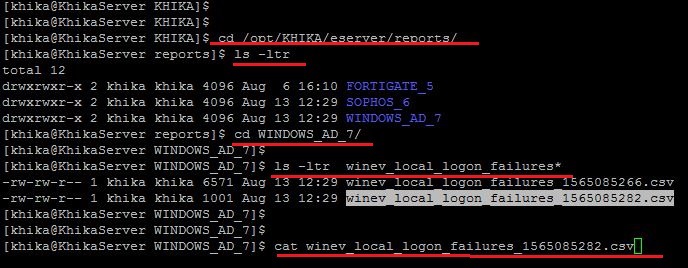

Case 3. Report data is displayed on Discover page after searching it using report search String but report CSV is not generated
It is also possible for some report that after searching report data on KHIKA Discover page. You will see data but report CSV was not generated because there is some filter in report script which is ignoring the data that you see in discover page.
If you want to debug an issue, please follow the below steps:
   1. Login into KHIKA Appserver
   2. Enter the command “psql -d khika_db ”
   3. Enter the query “select name,tag from application_transformerdefinition;”

      Now you will get all workspace name and tags associated with it.
   4. Enter “\q” command


   5. Go directory /opt/KHIKA /opt/KHIKA/eserver/log using command 	“cd /opt/KHIKA /opt/KHIKA/eserver/log”
   6. Enter command "ls -ltr".

      now you will see list of file with format “jserver_debug_processid.log”


   7. To select appropriate file to debug Enter Command “ps -ef | grep eserver”

      Now you will see all Eserver Process, in which you will see process id and tag. if the tag is not present then its default process.


From this, you will find the process which was responsible to run your report.
   8. Open the file name with process id using the command “vi jserver_debug_processid.log” and check logs related to the report you ran.
      Eg. For Windows_AD Report will open log file which has process id 4996. So open file  “jserver_debug_4996.log”

Did not receive reports csv email?
Resolution:
Case 1. SMTP server Settings are changed
Add the new SMTP settings from KHIKA GUI.To add SMTP setting in KHIKA click SMTP Server Settings.
Case 2. Email id was not configured for reports
In this case, configure the email id for a specific report. To configure email click here.
How to send or don't send reports to specific email id?
Resolution:
Please follow below steps:
   1. Select the report for which you want to send an email to a specific email id.


   2. Click on “Modify Report” button next to report name.

      In which you can see the option “Email Report To”. You can add or remove specific email id.


   3. Click on the update button.


Dashboards in KHIKA
Data is not displaying in Dashboard?
Resolution:
Case 1. Report csv is not generated
Please check if the report csv file for corresponding dashboard is generated or not. If reports csv is not generated then there is no data for that particular dashboard.
Click here to check if report related data is present but report is not running.
Case 2. If report csv was generated and it has data
Click on “Report history” tab to check the report status.
You will see “upload_error” status for dashboard corresponding report.
There are many reasons behind this issue like :
1. All the columns in the reports are not configured from UI.
2. Data type of the report column is not appropriate.
3. In the same workspace, there are two different reports which have the same name for Date column and its format is different in both reports.
To debug the issue please follow below steps:
1. Login into KHIKA Appserver.
2. Go to the directory /opt/KHIKA/UTILS using command “cd /opt/KHIKA/UTILS”.
3. Open the UploadReportToEs.log log file using the command “vi UploadReportToEs.log” and search for report CSV file which data was not showing on the dashboard.

4. Generally, mapping error occurred such as number format exception or date format parsing exception. To resolve such exception do following
1. Configure -> Reports
2. Select require workspace from workspace dropdown.
3. Search for required report ( report for which you are getting an error)
4. Click on “Modify Report” (see the following screenshot for steps from (1) to (4)
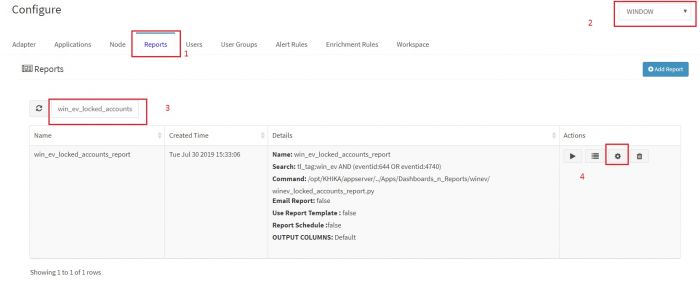 5. Select tab “Output Column Configuration”
6. Add missing column if required by clicking on “Add More Column” button.
7. Change Data type of existing column if required.
8. Click on the “Update” button to save and exit.
See the following screenshot for steps from (5) to (8)
5. Select tab “Output Column Configuration”
6. Add missing column if required by clicking on “Add More Column” button.
7. Change Data type of existing column if required.
8. Click on the “Update” button to save and exit.
See the following screenshot for steps from (5) to (8)
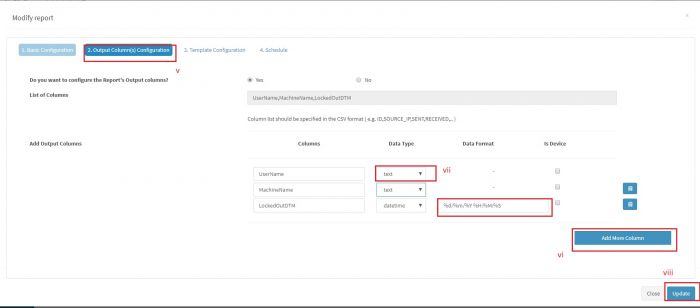


Error :Request time out
Resolution:
Case 1. Large date range
When we open the dashboard data is searched from the report index. Searching is an in-memory operation and requires high compute.
While selecting a date range for dashboard give an appropriate date range. If the data source report size is high then a search is applied to a huge amount of data and hence results in a high compute operation.
Bigger date range may cause the failure of the elastic search process as it gets out of memory.
We must give appropriate date range precisely to search the data to avoid this problem.
Case 2. Large depth and size of data aggregation in visualization
In the visualization keep the aggregation value low because internally while displaying data in dashboard search is applied.
Aggregation includes searching, sorting and some mathematical operation for which bulk amount of memory required and also more time required for internal operation.
Note – If you are launching any new process manually, then first verify KHIKA environment variables are set otherwise run following command to set KHIKA environment variables.
. /opt/KHIKA/env.sh
Terminating due to java.lang.OutOfMemoryError: Java heap space
Alertserver and Elasticsearch are two major components where we find out this heap space related issue.
Troubleshoot
We can solve this by increasing the memory for these components, but also check availability of memory on that machine.
Where to change memory for this components
1. Alertserver - For alertserver, you have to modify file /alertserver/bin/start.sh.
Find out variable JVM_OPTS initialization, increase values of -Xms -Xmx -Xmn
-Xms --> Initial heap size
-Xmx --> Maximum heap size
-Xmn --> Young generation heap size. Young generation represents all the objects which have a short life of the time.
-Xms and -Xmx should have the same value and the value should not exceed 8GB. -Xmn value should be around 20 - 25% of -Xmx.
2. Elasticsearch – For elasticsearch you have modify file elasticsearch/config/jvm.options
Change the following variables and increase its value.
-Xms --> Initial heap size
-Xmx --> Maximum heap size
-Xms and -Xmx should have the same value and the value should not exceed half of the memory on the system.
Getting error “Connection to node -1 could not be established. Broker may not be available”
This error is related to KAFKA connection problems, can be found in any process which needs KAFKA connection for performing a certain action.
1. First, verify the configuration file for the following variable has the right values. File location "/opt/KHIKA/Cogniyug.properties" OR in “/bin/Cogniyug.properties” of a specific process like alertserver, eserver or remoteclient.
    * kafka.server --> Kafka server and port, e.g. 192.168.1.155:9093
    * kafka.use.ssl --> boolean value representing connection is SSL enabled or not, (true/false)
    * kafka.ssl.truststore.location --> location to kafka.truststore.jks
    * kafka.ssl.truststore.password --> password for truststore
    * kafka.ssl.keystore.location  --> location to kafka.keystore.jks
    * kafka.ssl.keystore.password --> password for keystore
    * kafka.ssl.key.password --> SSL key password
    * kafka.use.sasl --> boolean value representing SASL is enabled or not (true/false)
      Note: In KHIKA we are using 9092 port for non-SSL communication and 9093 for SSL communication. If you are setting kafka.use.ssl to true the you must have to use 9093 port.
2. If all of these values are right and still getting same error then verify KAFKA server is up and running properly. Run following command to check kafka status and output should be same as image.

If you are not getting this output then you need to start Kafka manually. Using command
“/opt/KHIKA/3rdpartyUnix/kafka/bin/confluent start”
3. Your Kafka server is running and still getting the same error then it may have your network issue.
Check telnet output for a successful connection to the port.

If you get “connection refused” or not connected then check ‘iptable’ for any rule which is blocking this IP/port or check if any changes made in your network.
In RemoteClient/eserver/alertserver log file found error TOPIC_AUTHORIZATION_FAILED
This is SASL authentication realated error in KAFKA. In Kafka, we are creating SASL credentials for each customer. Identity of each customer node contains that information, so for remoteclient first verify value of remote.identity in Cogniyug.properties file and identity on “Node” tab.


If identity is same then due to some resone authentication at KAFKA side may be missing.
So run following command to restore all SASL authentications.
/opt/KHIKA/UTILS/KAFKA/run_KafkaUtils.sh -o KHIKA restore
Data collection is Stopped!!
There are many possibilities which are responsible for this issue.
- First, check on data aggregator if we are receiving data from device or not. Data collection types are either OSSEC or SYSLOG. If, do not get data then check the documentation on OSSEC/SYSLOG for its troubleshooting.
- If data aggregator receiving data from device then this might be a problem in Adapter which is parsing that data. So then check that particular adapter log for any error message.
- RemoteClient process is responsible for running adapters, so check remoteclient log in “/collection/log/” directory. In RemoteClient log, you might find problems related to KAFKA like “Broker may not be available” or “TOPIC_AUTHORIZATION_FAILED”.You can find its solution in Getting error “Connection to node -1 could not be established. Broker may not be available” and In RemoteClient/eserver/alertserver log file found error TOPIC_AUTHORIZATION_FAILED
- Remote client sends data in KAFKA and then Master(Eventenrichment) process for performing some action on that data (activity related to enrichment). Generally, this component failed due to heap memory problem or KAFKA related problems which are covered in the above sections.
- After that Master sends this processed data to KAFKA. Then the Eserver inserts this data into elasticsearch. Eserver may get failed due to KAFKA related issue like “Broker may not be available” or “TOPIC_AUTHORIZATION_FAILED”, you can find a solution for that in Getting error “Connection to node -1 could not be established. Broker may not be available” and In RemoteClient/eserver/alertserver log file found error TOPIC_AUTHORIZATION_FAILED
Eserver also failed due to elasticsearch connection problems, like heap error or mapping related issue.
While adding device in KHIKA get message "You have added maximum number of licensed devices. Please contact Support for help in this regard".

Resolution:
If you get above message while adding device in KHIKA it means you reach the maximum limit of adding devices in KHIKA as per license.So you can not add more devices in KHIKA. If you need more details on this or you want to change the license ,please contact KHIKA support team on info@khika.com
While accessing KHIKA UI for login you get the message like "The license information could not be loaded. Please contact your system administrator".

This error occurs when ElasticSearch process is down and the most probable reasons this may happen are as below:
1. If fired some heavy query in the search bar
Searching is an in-memory operation and requires high compute. While searching the data we must know on which data source we are firing the search, if the data source is a high data producer then the amount of data on which the search is applied is huge and hence results in a high compute operation.
Firing a generalized search on such a huge data for bigger date range may cause the failure of the elastic search process as it gets out of memory.
We must create our search string and appropriate date range precisely to search the data to avoid this problem.
2. Large Date range while accessing Dashboards
If the data source is a high data producer then the amount of data on which the dashboard is selected is huge for the large time range and hence results in a high compute operation.
Select a dashboard for a bigger date range may cause the failure of the elastic search process as it gets out of memory.
we must use a small date range like last 15 minute, today, last 24 hours, etc
3. Disk is Full
To know more about how the disk is full go to the section Most probable reasons why Disk is Full.
Resolution:
Please Contact KHIKA support to start Elasticsearch.
How to configure backup for a KHIKA Node ?
KHIKA Server provides a utility to do a daily backup of all important configuration and data files on a particular KHIKA node. The script needs to be manually configured as mentioned below:
- Goto "/opt/KHIKA/UTILS" location and open the "daily_backup_script.sh" script using vim editor as given below:

- Modify "daily_backup_script.sh" script and only add a required component/process in a "Process_At_Server" list which processes are running on a node. E.g. If the KHIKA node only functions as an aggregator, then list of processes should just specify 'AGGREGATOR' as: Process_At_Server="AGGREGATOR"

- Setup a cronjob to execute the daily backup script utilty using following command
![]()

- This daily backup script creates backup of khika at the "/home/khika/KHIKA_SERVER_BACKUP_<HOSTNAME>" as shown in below. Please copy the backup files to the desired backup drive or location so further safe keeping.It is strongly recommended to choose a location different from '/home/khika/' on a separate partition for backup files by editing the daily backup script

How to add a server for Server Hardening Compliance Report ?
Please refer the section "To add a server for hardening compliance report" on the page Customizing Hardening Policies
How to resume/stop KHIKA services after/prior server reboot?
KHIKA Servers may need to be occasionally restarted for maintenance purposes and it is important to resume KHIKA Services in a proper manner to enable proper functioning of KHIKA services. Based on the type of services offered by the KHIKA Server, the following services may be configured on the KHIKA server:
khika-db.service - The service is related to the processes associated with ElasticSearch NoSQL Database used by KHIKA.
khika-kafka.service - The service is related to the processes associated with Kafka message queue used by KHIKA.
khika.service - - The service is related to the all other KHIKA processes configured to function on the server.
Please note that KHIKA Services need to be started in proper order for correct functioning of KHIKA. The order is as mentioned below:
- khika-db.server (if applicable)
- khika-kafka.service (if applicable)
- khika.server
For a KHIKA Aggregator
The KHIKA Data Aggregator will typically use only the "khika.service" which will internally launch the "RemoteClient" process.
khika.service
- To start khika.service use following command
sudo systemctl start khika.service
- To stop khika.service use following command
sudo systemctl stop khika.service
- To check status of khika.service use following command.
sudo systemctl status khika.service
- To enable khika.service use following command
sudo systemctl enable khika.service
For a KHIKA Application Server
The KHIKA Application Server may typically use the "khika.service", "khika-db.service" and "khika-kafka.service". The "khika.service" depends on the "khika-db.service" and "khika-kafka.service" and hence these services must be started prior to starting the "khika.service".
khika-db.service
khika-db.service is the khika database service which consist of postgresql and elasticsearch processes.Usually this service take long time (10-20 mins) to start.
- To start khika-db.service use following command
sudo systemctl start khika-db.service
- To stop khika.service use following command
sudo systemctl stop khika-db.service
- To check status of khika.service use following command.
sudo systemctl status khika-db.service
- To enable khika.service use following command
sudo systemctl enable khika-db.service
khika-kafka.service
The khika-kafka.service is related to KAFKA message server processes. This service depend on "khika-db.service" hence before starting this service please check "khika-db.service"
- To start khika-kafka.service use following command
sudo systemctl start khika-kafka.service
- To stop khika-kafka.service use following command
sudo systemctl stop khika-kafka.service
- To check status of khika-kafka.service use following command.
sudo systemctl status khika-kafka.service
- To enable khika-kafka.service use following command
sudo systemctl enable khika-kafka.service
khika.service
khika.service is related to all other KHIKA processes and depends on khika-db.service and khika-kafka.service. Hence these services need to be available before khika.service is started.
- To start khika.service use following command
sudo systemctl start khika.service
- To stop khika.service use following command
sudo systemctl stop khika.service
- To check status of khika.service use following command.
sudo systemctl status khika.service
- To enable khika.service use following command
sudo systemctl enable khika.service
How to start/stop KHIKA Services on a particular node?
Depending on the role played by KHIKA node, some or all of the khika services (khika,khika-kafka, khika-db) need to be used to stop or start KHIKA node. For more details on using KHIKA Services, please refer Khika Services
How to configure KHIKA Services on a particular node?
Depending on the role played by the KHIKA node, some or all of the khika services (khika,khika-kafka, khika-db) need to be configured on the KHIKA node. Please follow the procedure mentioned below:
1. On the KHIKA Node, go to /opt/KHIKA/UTILS/init_script directory
cd /opt/KHIKA/UTILS/init_script
2. Depending on the role of KHIKA node, copy the relevant khika service script to /etc/systemd/system directory
khika-db.service: Service to start/stop ElasticSearch and Postgres Database
cp khika-db.service /etc/systemd/system
khika-kafka.service: Service to start/stop Kafka message broker
cp khika-kafka.service /etc/systemd/system
khika.service: This is service for starting/stopping all other the KHIKA processes
cp khika.service /etc/systemd/system
NOTE: if node is not configured for kafka process then please do not copy khika-kafka.service
NOTE: if node is not configured for elasticsearch or postgres processes then please do not copy khika-db.service
3. Using root account enable the service(s)
       systemctl enable khika-db.service (if applicable)
       systemctl enable khika-kafka.service ( if applicable)
       systemctl enable khika.service
4. Please make sure that requiretty is disabled in /etc/sudoers file.
- open the /etc/sudoers file
- search for requiretty
- change that line to following one
Defaults !requiretty
NOTE THAT there is ! sign before requiretty
5. Stop all the process then using systemctl start the applicable services (viz. khika-kafka, khika-db and khika service).
How to give a user access to a certain workspace
1.First check the User Group assigned to that workspace in workspace tab.for that go to configure->workspace tab.

2.After that go to configure->User Groups tab,select the user group from Group list which is associated with the workspace.

3.Click on Add user and select the user which we want to give access to that workspace and click on Add button

4.After clicking on Add button you will get a popup as shown below.

How to use Kafkatool to do a KHIKA Healthcheck ?
KHIKA internally leverage Apache Kafka (https://kafka.apache.org/) as the message queue which forms the back bone of all communication that happens between various KHIKA components. The Kafka tool utility provides a visibility in Kafka metrics and thus provides a concise representation of various KHIKA components, their individual queues (topics) & workers and can be used identify problems quite easily.
   To launch KHIKA kafka tool use the following commands:
   cd /opt/KHIKA;
   . /opt/KHIKA/env.sh
   python TLKafkaTool.py [-b <kafka-broker_ip:port>]

   This should launch the kafka tool as shown in the screenshot below:

With Reference to the scheenshot below, let us assume the customer's alias (short name) to be 'alpha'. The screenshot will show the consumer groups, topics, the worker processes and the lag for each of topics. Note we need to focus on topics with 'Alpha' suffix. The screehshot shows the following topics:
   Consumer Group 				Topic
   ---------------				------
   ESImport-alpha				Import-Alpha
   AnomalyEngine				Import-Alpha
   Master_localhost			        EventEnrichment-Alpha
   CEPEngineConfigNewAlpha		        AlertRuleConfig-Alpha
   CEPEngineAlpha				Import-Alpha
   Alpha					ReportWorker
   Alpha					Transformer
   Each remoteclient process has its own consumer group and topic
   Consumer Group 				Topic
   ---------------				------
   Remote_<KEY>                                RemoteTopic<KEY>
   There is also some common topic which is shared by all tenants:
   Consumer Group 				Topic
   ---------------				------
   appserver				        TLConfigTopic
We need to look at the value of parameters LAG & CLIENT-ID associated with each topic so as to understand if there are any issues with the topic.
- If Lag value is large (greater than 1000) consistently for a period of 10 mins and it shown no signs of coming down, then this indicates a problem.
- Similarly if the CLIENT-ID value is empty or '-', then it indicates that the worker to process the messages for this topic does not exist.