Difference between revisions of "FAQs"
(→Postgres database size has increased) |
(→Report's files does not get archived) |
||
| Line 654: | Line 654: | ||
===Report's files does not get archived=== | ===Report's files does not get archived=== | ||
Reports CSV files get stored at location "'''/opt/KHIKA/appserver/reports'''" and "'''/opt/KHIKA/eserver/reports'''" | Reports CSV files get stored at location "'''/opt/KHIKA/appserver/reports'''" and "'''/opt/KHIKA/eserver/reports'''" | ||
| − | If you found that above mentioned directories taking more space | + | If you have found that above mentioned directories is taking more space, then do following steps : |
1. Make sure archival cron is configured for reports ('''/opt/KHIKA/UTILS/manage_logs.sh''')Use following command to check cron | 1. Make sure archival cron is configured for reports ('''/opt/KHIKA/UTILS/manage_logs.sh''')Use following command to check cron | ||
| Line 660: | Line 660: | ||
[[File: Crontab.jpg | 700px]]<br> | [[File: Crontab.jpg | 700px]]<br> | ||
| − | 2. Make sure the following entries | + | 2. Make sure the following entries are present in file '''/opt/KHIKA/UTILS/manage_logs.sh''' |
• '''find /opt/KHIKA/appserver/reports -mtime +7 -type f | xargs gzip'''<br> | • '''find /opt/KHIKA/appserver/reports -mtime +7 -type f | xargs gzip'''<br> | ||
• '''find /opt/KHIKA/tserver/reports -mtime +7 -type f | xargs gzip'''<br> | • '''find /opt/KHIKA/tserver/reports -mtime +7 -type f | xargs gzip'''<br> | ||
| Line 666: | Line 666: | ||
If above entry is missing then add it using common editor like vi or vim. | If above entry is missing then add it using common editor like vi or vim. | ||
| − | 3. If reports | + | 3. If reports are too old and there is no option to free disk space then delete the reports. Use the following commands to delete report files which are older than 1 year |
• '''find /opt/KHIKA/appserver/reports -type f -mtime +365 -delete'''<br> | • '''find /opt/KHIKA/appserver/reports -type f -mtime +365 -delete'''<br> | ||
• '''find /opt/KHIKA/tserver/reports -type f -mtime +365 -delete'''<br> | • '''find /opt/KHIKA/tserver/reports -type f -mtime +365 -delete'''<br> | ||
Revision as of 10:07, 14 August 2019
Contents
- 1 How to check if raw syslog data is received in the system? What if it is not received?
- 2 Why can’t I see any raw data on Discover Screen?
- 3 How to select data related to a particular device on your Dashboard?
- 4 How do I estimate my per day data?
- 5 SMTP settings in KHIKA
- 6 Dealing with Syslog Device in KHIKA
- 7 Dealing with Ossec Device in KHIKA
- 7.1 Failing to add ossec based device
- 7.2 Data is not coming in KHIKA
- 7.3 Ossec Agent And Ossec Server Connection issue
- 7.4 Data Collection Issue event if the agent is successfully connected to OSSEC Server.
- 7.5 Failing to Remove Ossec based device.
- 7.6 How to Find list of ossec agents along with it's status on command line
- 7.7 How to check logs in Linux Ossec Agent
- 7.8 How to check logs in Windows Ossec Agent
- 7.9 How to check OSSEC Server logs
- 7.10 How to Stop OSSEC Server using command line
- 7.11 How to Stop OSSEC Agent using command line
- 7.12 How to Start OSSEC Server using command line
- 7.13 How to Start OSSEC Agent using command line
- 7.14 How to Restart OSSEC Server
- 7.15 How to Restart Windows Ossec Agent
- 7.16 How to Restart Linux Ossec Agent
- 8 KHIKA Disk Management and Issues
- 8.1 Size of indexes representing raw logs grows too much
- 8.2 Log files of KHIKA processes not deleted
- 8.3 Postgres database size has increased
- 8.4 Report's files does not get archived
- 8.5 Raw log files does not get archive and deleted for ossec and syslog device
- 8.6 Cold/Offline storage partition gets full or unmounted
- 8.7 Elasticsearch snapshot archival utility not working properly
- 9 Elasticsearch Snapshot functionality configuration
- 10 Check Status of Snapshot / Restore Functionality
How to check if raw syslog data is received in the system? What if it is not received?
In the section for adding data of syslog based devices we have explained how to enable syslog forwarding on the the data sources first and then add that device into KHIKA. When we add a device successfully, we can see the device entry in the “List of Devices” tab. (For this, go to Configure – Adapter – Manage Devices next to that Adapter.)
However if raw syslogs are not received from that device, we get an error while adding the device.
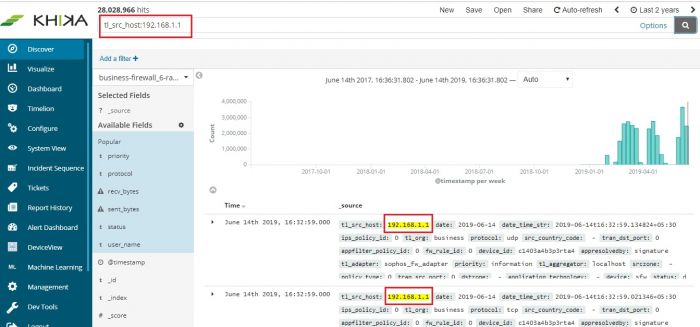
It is recommended to wait for upto 10 minutes before checking its data. To check whether we are receiving this device’s data in KHIKA, go to “Discover” screen from the left menu. Search for the IP address of the device in the search textbox on the top of the screen.
In our example from the image, IP address is “10.2.5.6”. In the search bar in the Discover screen, just enter “10.2.5.6”. This is for showing up any and all data relevant to the device with this IP.
If you can see data for this IP address, the logs are being received into KHIKA successfully.
If not, please check section for adding data of syslog based devices. Both the steps – adding a device in KHIKA as well as forwarding syslogs from that device to KHIKA should be verified again.
Why can’t I see any raw data on Discover Screen?
On the Discover screen, you have to choose 2 things to bring up your data :
- Time duration
- Index pattern
Select the required index pattern from the dropdown on the left of the Discover Screen. This selects your data type and whether it is “raw” or calculated “rpt” data. Refer section for help on changing index
Then select the time duration of data you want to see from the time picker functionality on top right. Selecting time window is explained here
If time duration is selected too large, it may severely affect the performance of MARS. We recommend not selecting the data beyond Last 24 hours. Your searches may time out if you select large Time Ranges.
Reduce your time window and try again. It is advised to keep a lesser time window. However on the contrary, if there is no / very less data in the picked time window, you might want to increase your time window from the time picker and load the screen again.
Every dashboard in KHIKA will have multiple devices' data in it. For example, a linux logon dashboard has information about all the linux devices in the "LINUX" workspace say. the name of the relevant workspace is appears before the name of the dashboard.
To see data on the dashboard for only one linux device, you have to select the required device on your Dashboard. There are couple of ways to select an APV on your dashboard :
- Add a filter
- Enter Search query
The following procedure is applicable to all Dashboards.
Steps for Adding a Filter
On each dashboard, there is an option, “Add a filter”. Click on the “+” sign to add a new one. Use the simple drop downs in combination, to create your logical filter query.
faq3.1
faq3.2
The first dropdown is the list of fields from our data. We have selected “server_ip” here. The second dropdown is a logical connector. We have selected “is” in this dropdown. The third dropdown has the values of this field. We have selected one device say 10.13.1.3 here. So now, our filter query is : “server_ip is 10.13.1.3”
Click on Save at the bottom of this filter pop up.
Your Dashboard now shows data for only the selected device in all the pie charts, bar graphs and summary table – everywhere in the dashboard.
The applied filter is seen on top.
faq3.3
To remove the filter, hover on the filter icon on top (selected in red in above figure). Icons appear. Click on the bin icon ifaq3.1 to remove the filter. The Dashboard returns to its previous state.
faq3.4
Please Note : If this is just a single search event, donot follow further steps. If you want to save this search for this particular device with the Dashboard, follow steps given further to save the search.
Click on Edit link on the top right of the Dashboard – Save link appears. Click on Save to save this search query with the dashboard.
faq3.5
The filter currently applied shall continue to be seen on top of your Dashboard. You can remove this filter at any point of time in the future by clicking on the bin icon on your dashboard – as already explained.
Steps to Search and Save
On the top of the Dashboard, there is a text box for search. Enter your device search query for a particular device in this box.
faq3.6
We have entered server_ip:”10.13.1.3” . This is the syntax for server_ip equals to 10.13.1.3. Click on the rightmost search button in that textbox to search for this particular device on the dashboard.
All the elements on the Dashboard shall now reflect data for the selected device.
faq3.7
Please Note : If this is just a single search event, donot follow further steps. If you want to save this search for this particular device with the Dashboard, follow steps given further to save the search.
Click on Edit link above the search textbox – Save link appears. Click on Save to save this search query with the dashboard.
faq3.8
This shall stay with the Dashboard and will be seen every time we open the Dashboard.
To remove the search, select the search query which you can see in that textbox, remove / delete it. Click on Edit and Save the Dashboard again. It changes back to its previous state.
faq3.9
How do I estimate my per day data?
Please refer the dedicated section to calculate your per day data size in KHIKA
SMTP settings in KHIKA
We need to make SMTP settings in KHIKA so that KHIKA alerts and reports can be sent to relevant stakeholders as emails.
Please refer the dedicated section for SMTP settings
Dealing with Syslog Device in KHIKA
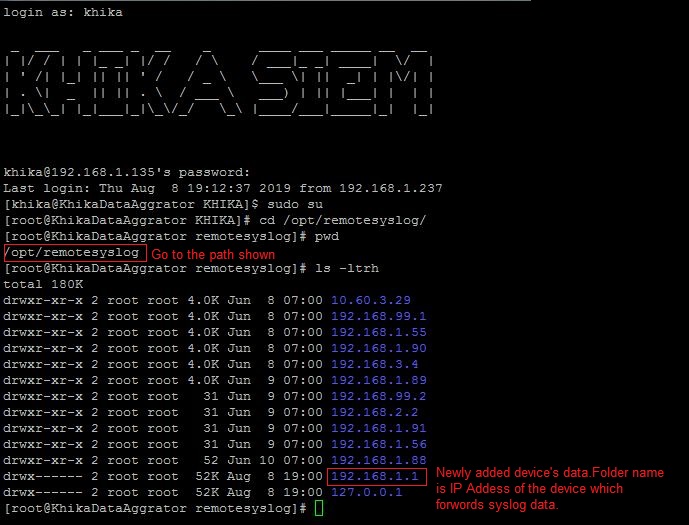
Syslog service is pre-configured on your KHIKA aggregator server (on UDP port 514). Syslogs are stored in /opt/remotesylog directory with IP address of the sending device as directory name for each device sending data. This way, data of each device is stored in a distinct directory and files. For example, if you are sending syslogs from your firewall which as IP of 192.168.1.1, you will see a directory with the name /opt/remotesylog/192.168.1.1 on KHIKA Data Aggregator. The files will be created in this directory with the date and time stamp <example : 2019-08-08.log>. If you do a "tail -f" on the latest file, you will see live logs coming in.
When you want to add a new device into KHIKA
1. Note the IP address of your KHIKA Data Aggregator.
2. Please refer to OEM documentation on how to enable Syslogs. We encourage you to enable the lowest level of logging so that you capture all the details. Syslog server where logs should go is IP address of your KHIKA Data Aggregator and port should be UDP 514.
   For enable syslog of preconfigured apps in KHIKA click on the below link:
   • Symantec Antivirus
   • Cisco Switch
   • Checkpoint Firewall
   • Fortigate Firewall
   • PaloAlto Firewall
   • Sophos Firewall
3. Note the IP address of the device sending the logs (example 192.168.1.1)
4. Now go to KHIKA Data Aggregator and login as "khika" user and do "sudo su".
5. cd to /opt/remotesylog and do "ls -ltr" here. If you see the directory with the name of the ip of the device sending the data, you have started receiving the data in syslogs.
Data is not receiving on Syslog Server
- please wait for some time.
- Some devices such as switches, routers, etc don’t create too many syslogs.
- It depends on the activity on the device. Try doing some activities such as login and issue some commands etc. The intention is to generate some syslogs.
- Check if logs are generating and being received on KHIKA Data Aggregator in the directory "/opt/remotesylog/ip_of_device". Do ls -ltrh
- If logs are still not being received, Please check the following points.
- Check firewall settings on KHIKA Data Aggregator. Wait for some time perform some actions on the end device to generate logs and check in directory /opt/remotesylog/ip_of_device. Do "ls -ltr"
   Check firewall status
   systemctl status firewalld
   If firewall status is active, then do the following commands to inactive and disable firewalld.
   systemctl stop firewalld
   systemctl disable firewalld
   Flush iptables
   sudo iptables –flush
- Check if there is any firewall between KHIKA Data Aggregator and allow communication from device to KHIKA Data Aggregator on port 514 (UDP)
- Login to KHIKA Data Aggregator and do tcpdump
sudo tcpdump -i any src <ip_of_ device> and port 514
If you see the packets being received by tcpdump, restart syslog service using command.
   systemctl syslog-ng stop, Then wait for some time.
   systemctl syslog-ng start
Make sure you are receiving the logs in the directory /opt/remotesylog/ip_of_device Go to Started Receiving the logs only after you start receiving the logs.
Started Receiving the logs on Syslog server
Now you need to add a device from KHIKA GUI.
If the similar device of a data source has already been added to KHIKA
- Add this device to the same Adapter using following steps explained here.
- Else, check if App for this device is available with KHIKA. If the App is available, load the App and then Add device to the adapter using the steps explained here.
- Else, develop a new Adapter (and perhaps a complete App) for this data source. Please read section on how to write your own adapter on Wiki, after writing your own adapter, testing it, you can configure the adapter and then start consuming data into KHIKA. Explore the data in KHIKA using KHIKA search interface
Dealing with Ossec Device in KHIKA
Failing to add ossec based device
1. Time out Error
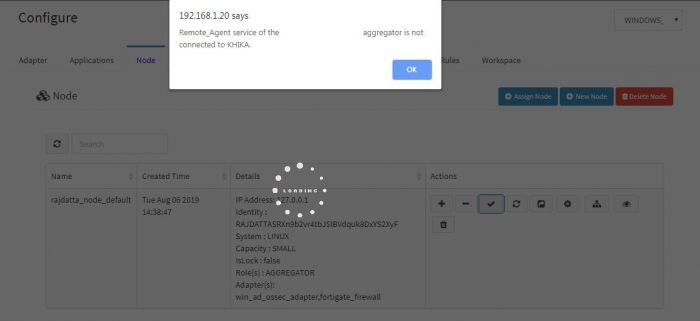
Check if you are getting following Error while adding the device.

This means your aggregator is not connected to KHIKA AppServer.
Check if your aggregator is connected to KHIKA server.
   1. Go to node tab in KHIKA GUI.
   2. Click on Check Aggregator Status button as shown in the screenshot below


   3. If it shows that the aggregator is not connected to KHIKA Server, it means that you aggregator is not connected to KHIKA AppServer.<enter link here that explains check aggregator status and solve the problem ><vrushali>
2. Device is already present
Check if you are getting the following message while adding the device
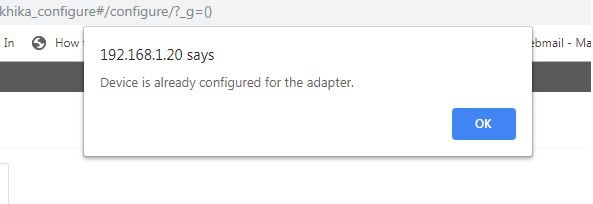
We cannot add the same device twice, Check if you already have added the device in the device list.
Data is not coming in KHIKA
Check your agent status to see if it is connected to OSSEC Server(KHIKA Aggregator).
To find the list of ossec agents along with its status click here
If it is showing the result as Active then we might first see if our search string is right. There might be some cases where we are using wrong search string or wrong index pattern to search for the data.
1. Go to the workspace in which the device is added.
2. Check in which workspace the device is added, refer the following screenshot
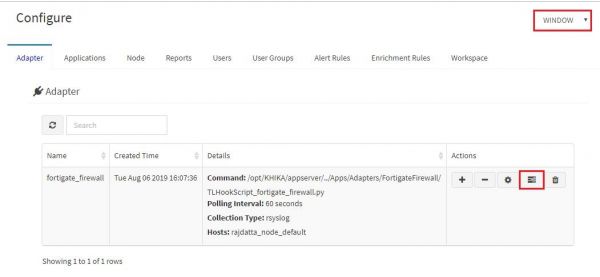
3. We may need to select appropriate index pattern in which data can be searched for requested server.
4. Check Data is available on Discover page
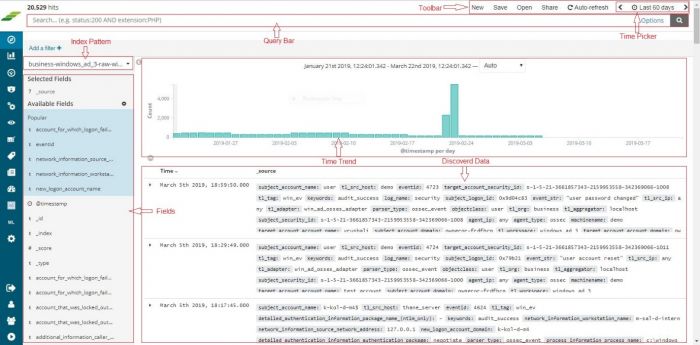
5. In the search bar we should include the server name to check if related logs are coming or not.
   Examples:
   1. If customer name is XYZ and if the server is in windows_servers workspace then we must select <XYZ>_<windows_servers>_raw_<windows> index pattern.

   2. tl_src_host : “<servername>”
   <insert screenshot where above search string is given><vrushali>
6. If you don’t find data from this device using above steps, go for further troubleshooting.
Ossec Agent And Ossec Server Connection issue
Ossec Server not running
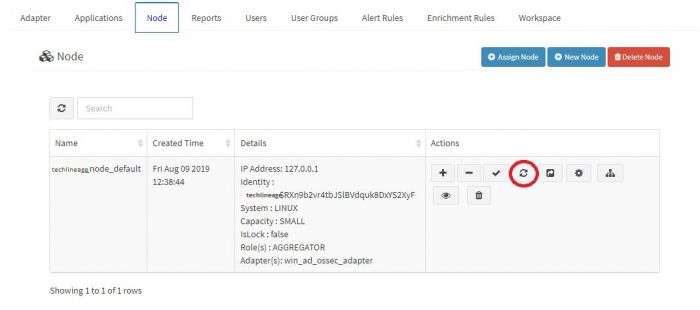
There could be a problem where ossec server is stopped and is not running.
Go to node tab and click on Reload Configuration button to restart the ossec server.To check how to restart ossec serevr click[FAQs#How to Restart OSSEC Server|here]
There is a firewall between the agent and the server you will find following logs
If you have the following message on the Linux agent log or Windows agent log.
Waiting for server reply (not started)
Resolution: Check with your concerned firewall team, if there is a firewall between ossec agent and the ossec server. You may need to open UDP 1514 port between ossec server and ossec agent. You can check traffic on between ossec agent and ossec server (KHIKA Aggregator) using the following command
tcpdump -i eth0 src xx.xx.xx.xx and port 1514
Where, eth0 is an ethernet interface this maybe with a different name on your server
xx.xx.xx.xx is an IP address in you case server IP-address if an agent, 1514 is a port address of ossec server. See the following screenshot for reference.

Wrong authentication keys configured (you imported a key from a different agent)
If that’s the case, you would be getting logs similar to Waiting for server reply (not started) on the agent side and Incorrectly formated message from 'xxx.xxx.xxx.xxx'. on the server-side.
1. Check Windows Ossec agent logs
2. Check Linux Ossec agent logs
3. Check Ossec server log
Resolution :
You must add correct key for agent which is generated by ossec server.
1. Importing the ossec key to Windows ossec agent
2. Importing the ossec key to Linux ossec agent
Ossec issues in linux agent.
1. If you have logs similar to the following in /opt/ossec/logs/ossec.log.Click here to check Linux ossec agent logs:
ERROR: Queue '/opt/ossec/queue/ossec/queue' not accessible: 'Connection refused'. Unable to access queue: '/var/ossec/queue/ossec/queue'. Giving up.
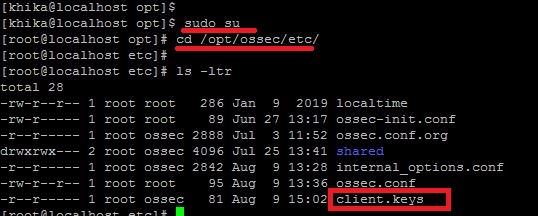
This problem occurs when there is an issue related to permissions or ownership of client.keys file.(/opt/ossec/etc/client.keys).It should be something as given below.

In the above screenshot read permission for group “ossec” is not set for file client.keys
To solve this issue please set the permission and ownership of client.keys as follow:
   1. Do ssh Login as user khika

   2. Set root user using sudo su command.

   3. cd /opt/ossec/etc/


   4. chmod 440 client.keys

   5. chown root:ossec client.keys

   6. cd /opt/ossec/bin

   7. ./ossec-control restart
2. If you have logs similar to "ERROR: Authentication key file '/opt/ossec/etc/client.keys' not found." in /opt/ossec/logs/ossec.log.Click here to check Linux ossec agent logs
This means the file client.keys is not available on path "/opt/ossec/etc/"
Resolution:
Please fetch the key for this agent again from KHIKA GUI.Steps to extract key from KHIKA GUI and Import unique key in agent
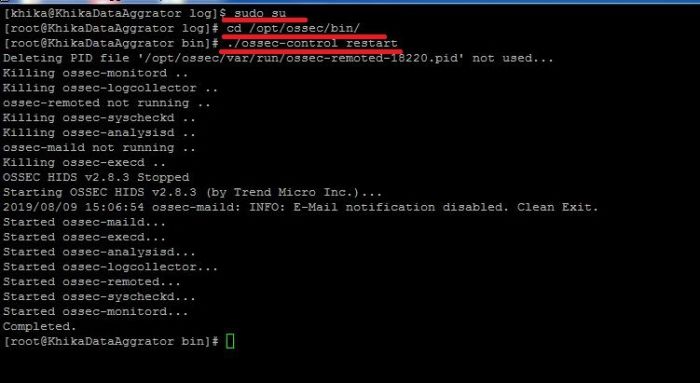
Restart The Ossec Agent
   1. Do ssh Login as user khika

   2. Set root user using sudo su command

   3. cd /opt/ossec/bin/

      This command will take you to the directory /opt/ossec/bin/)

   4. ./ossec-control restart
3. If you have logs similar to WARN: Process locked. Waiting for permission... in /opt/ossec/logs/ossec.log. Click here to check Linux ossec agent logs
Case I: Wrong IP of Aggregator given while installing the agent.
Resolution:
   1. Go to /opt/ossec/etc directory using following command.

      cd /opt/ossec/etc/

   2. Open the ossec.conf file present in the directory.

      vi ossec.conf

   3. You must give your KHIKA Aggregtor IP in server ip field.

      <server-ip>xxx.xxx.xxx.xxx</server-ip>

   4. Close the editor after saving the changes.

      :wq

   5. Restart The Ossec Agent.

      i.  cd /opt/ossec/bin/

      ii. ./ossec-control restart
Case II: RIDS Mismatch Issue
Resolution:
   1. Go to cd /opt/ossec/etc/

   2. vi internal_options.conf

   3. Check for the following line in this file and set the value to "0"

      remoted.verify_msg_id=0

   4. Close the editor after saving the changes

      :wq

   5. Restart The Ossec Agent.

      i.  cd /opt/ossec/bin/

      ii. ./ossec-control restart

   6. Check if the problem is solved else try following steps:

      1.  Stop ossec server process

      2.  Stop Ossec agent process

         Note : know your agent id by firing command "agent_control -l" in /opt/ossec/bin directory. You will find your agents id by this command.

      3. Ossec Server Side Resolution

         i.   Login to KHIKA Aggregator and type sudo su

         ii.  Go to the directory /opt/ossec/queue/rids/ using "cd /opt/ossec/queue/rids/"

         iii. Delete the file with the name of your agents id. Using following command : rm <agent_id>
      4. Ossec Agent Side Resolution

         i.   Login to your ossec agent and type sudo su

         ii.  Go to the directory /opt/ossec/queue/rids/ using "cd /opt/ossec/queue/rids/"

         iii. type rm -rf * in this directory.

      5.  Start ossec server process

      6. Start Ossec agent process
Ossec Issue on Windows Client Side.
Note: We must install the Ossec agent on windows using Administrator(Local Admin).
1. If you have logs similar to WARN: Process locked. Waiting for permission... in ossec.log.Click here to check Windows ossec agent logs
Resolution:
   1. Login to OSSEC Agent and check the file "internal_options.conf" which is present in the directory "C:\Program Files (x86)\ossec-agent" and open it.

   2. Check for the following line in this file and set the value to "0" and save it.

      remoted.verify_msg_id=0

   3. Restart Ossec Agent


   4. Check if the problem is solved else try following steps

      1. Stop Ossec Server Process

      2. Stop Ossec Agent Process


         Note: know your agent id by firing command "agent_control -l" in /opt/ossec/bin directory. You will find your agents id by this command.

      3. Ossec Server Side Resolution

         i.   Login to KHIKA Aggregator and type sudo su.

         ii.  Go to the directory /opt/ossec/queue/rids/ using "cd /opt/ossec/queue/rids/"

         iii. Delete the file with the name of your agents id. using rm <agent_id>

      4. Ossec Agent Side Resolution

         i.  Go to the directory "C:\Program Files (x86)\ossec-agent\rids"

         ii. Delete the files present in this directory.

      5. Start Ossec Server.


      6. Start Ossec windows Agent.
Data Collection Issue event if the agent is successfully connected to OSSEC Server.
Centralized configuration is not pushed to ossec agent.
KHIKA Uses a centralized configuration to fetch data from all the devices(windows,linux, etc)
We may need to check if the configuration is pushed at agent side so as to ensure the data collection does not have any issues.
   1. Login to OSSEC SERVER (KHIKA data Aggregator). and become root using command “sudo su”.

   2. Check the information of your agent. using the following steps

      1. Go to directory "/opt/ossec/bin/" using cd /opt/ossec/bin/

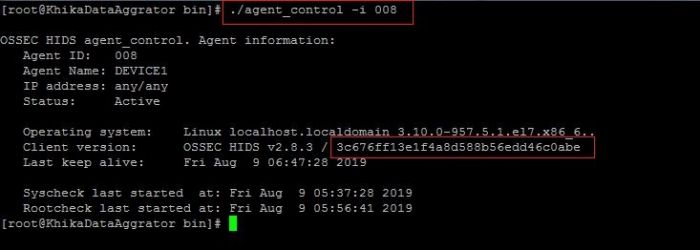
      2. ./agent_control -i <agent_id>

         Note: know your agent id by firing command "agent_control -l" in /opt/ossec/bin directory on KHIKA Aggregator. You will find your agent's id by this command.


      3. Note the client version information we got using above command. This md5sum should match with md5sum of centralized configuration file present at KHIKA Aggregator.

      4. Go to directory "/opt/ossec/etc/shared/" using command "cd /opt/ossec/etc/shared/"

      5. Check the md5sum of centralized config file which is agent.conf using command :  md5sum agent.conf


      6. Check If this md5sum matches with the checksum of your agent we noted earlier.

      7. Restart Ossec Agent And Ossec Server Process.
Auditing is not enabled on agent.
For windows related devices, KHIKA monitors windows standard event logs related to security and other prospects. We must check if auditing is enabled at windows server so as to integrate the data with KHIKA.
For linux related devices, KHIKA ossec agent fetches data from different types of files such as "/var/log/secure" , "/var/log/messages" , "/var/log/maillog" etc. Please check if Linux server is generating logs on the server itself.
If the problem persists, Please reinstall the Ossec agent(Make sure you are root while installing on Linux and are administrator while installing on windows device.)
Note: If none of the above cases match your problem or does not solve the issue, Please try to reinstall the ossec agent.
1. Reinstall Windows OSSEC Agent
2. Reinstall Linux OSSEC Agent
Failing to Remove Ossec based device.
Time out Error
Check if you are getting following Error while adding the device.
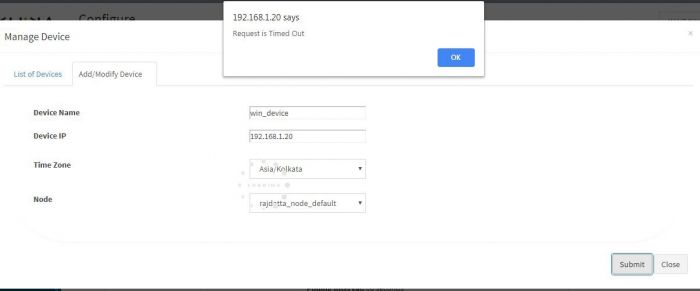
Aggregator is not connected to KHIKA AppServer.
Check if your aggregator is connected to KHIKA server.
   1. Go to node tab in KHIKA GUI.
   2. Click on Check Aggregator Status button as shown in the screenshot below
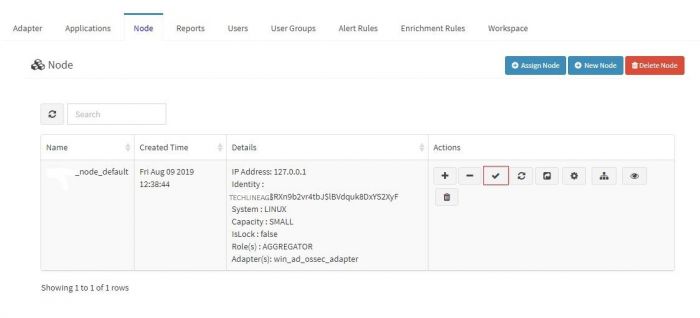
If it shows that the aggregator is not connected to KHIKA Server, it means that you aggregator is not connected to KHIKA AppServer.<enter link here to connect aggregator for our khika appserver troubleshooting>
How to Find list of ossec agents along with it's status on command line
1. Do ssh login as user "khika” or “root" on KHIKA Aggregator
2. Use following command ( if you login as user khika)
sudo su
3. Go to directory "/opt/ossec/bin"
cd /opt/ossec/bin
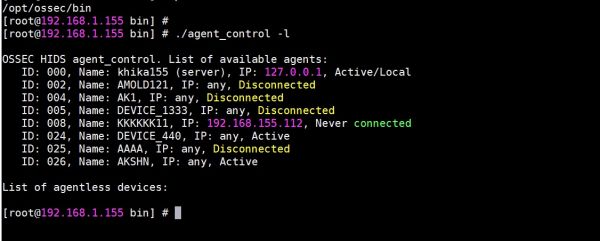
4. Use the following command to list all agents added on ossec server (see below screenshot)
./agent_control -l
5. To find only connected agents list use following command
./agent_control -lc
6. To find disconnected agents list use following command
./agent_control -l | grep "Disconnected"
How to check logs in Linux Ossec Agent
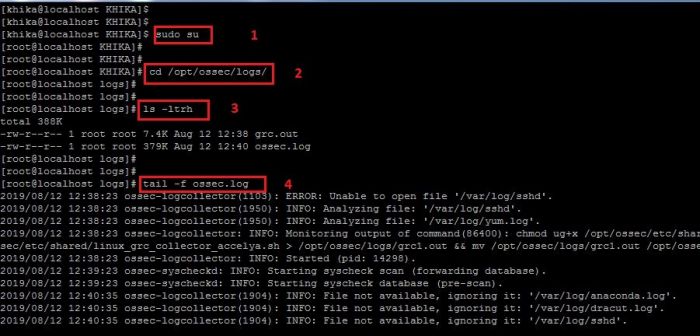
1. To check the logs of your ossec agent installed on your linux server for debugging, You must need to go to the following directory:
/opt/ossec/logs
2. Become root user using the command "sudo su"
3. Go the the above mentioned directory using "cd /opt/ossec/logs" command.
4. type " ls -ltrh " to list the files and directories present in the directory.
5. type the following command to check the log file (ossec.log ).
tail -f ossec.log
6. Refer to the screenshot given below:
7. You can also open the file in the vi Editor the check for the issues related to the connection with Ossec Server. For this, you may need to use the following command to open the log file of ossec agent in vi editor:
vi ossec.log
8. This is how you can check the logs of your ossec agent for troubleshooting.
How to check logs in Windows Ossec Agent
1. Open Manage Agent Application which is available in all programs or go to the following path:
C:\Program Files (x86)\ossec-agent
2. Search for win32ui in this directory and open it using Run as Administrator.
3. Please refer to the screenshot given below.
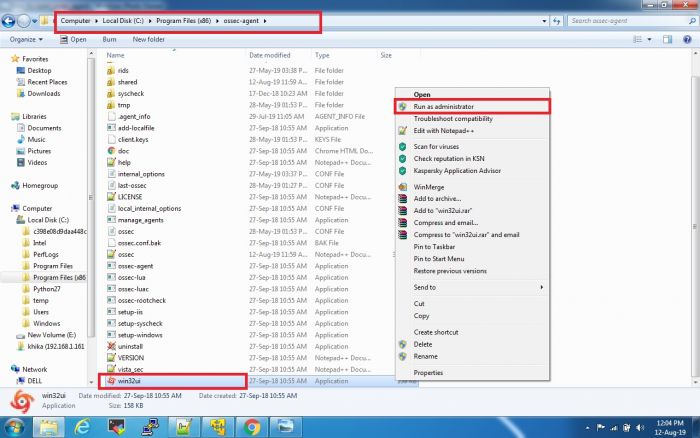
4. This will open a window as given below:
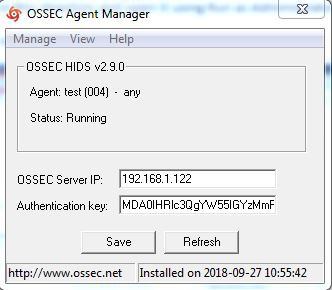
5. Click on the view tab and then click on log to open the ossec agent's log file.
Note: This file is used for debugging the problem related to the connection with ossec server.
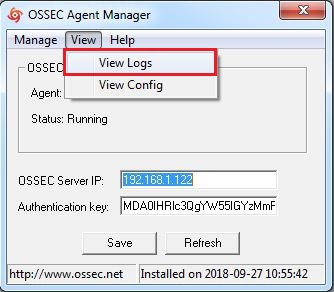
6. This operation will open a windows ossec agent log which is used for debugging.
How to check OSSEC Server logs
1. To check the logs of your ossec server which is installed on your KHIKA Aggregator for debugging, You must need to go to the following directory:
/opt/ossec/logs
2. Become root user using the command "sudo su"
3. Go the the above mentioned directory using "cd /opt/ossec/logs" command.
4. Type " ls -ltrh " to list the files and directories present in the directory.
5. Type the following command to check the log file (ossec.log).
tail -f ossec.log
6. Refer to the screenshot given below:
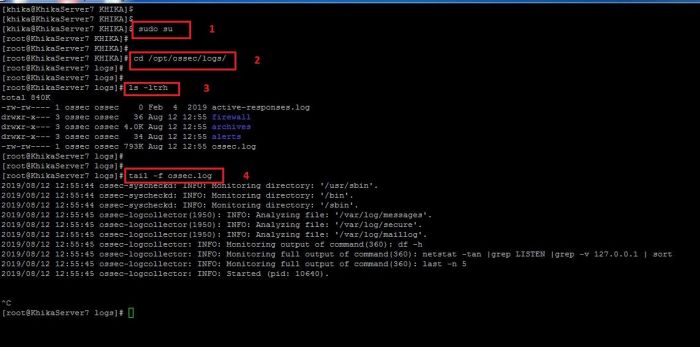
7. You can also open the file in the vi Editor the check for the occurred issues. For this you may need to use the following command to open the log file of ossec server in vi editor:
vi ossec.log
8. This is how you can check the ossec server-side logs.
How to Stop OSSEC Server using command line
1. To Stop the linux OSSEC Server which is preconfigured on your KHIKA Aggregator you will have to go to the following directory:
/opt/ossec/bin
2. Log in to KHIKA Aggregator and become root user using the command "sudo su"
3. Go the the above mentioned directory using "cd /opt/ossec/bin" command.
4. Type " ls -ltrh " to list the files and directories present in the directory.
5. Type following command to restart the ossec agent.
./ossec-control stop
6. Refer to the screenshot given below:
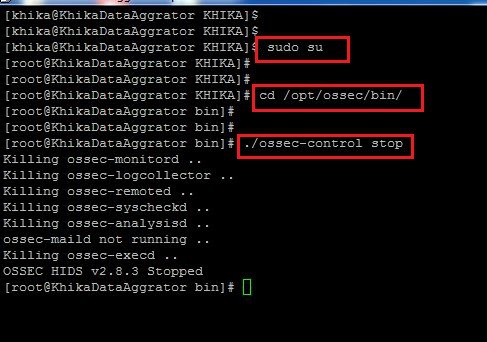
7. Your OSSEC Server is Stopped.
How to Stop OSSEC Agent using command line
1. To Stop the linux OSSEC Agent which is preconfigured on your Device which you want to monitor, you will have to go to the following directory:
/opt/ossec/bin
2. Log in to linux device where ossec agent is installed and become root user using the command "sudo su"
3. Go the the above mentioned directory using "cd /opt/ossec/bin" command.
4. Type " ls -ltrh " to list the files and directories present in the directory.
5. Type following command to restart the ossec agent.
./ossec-control stop
6. Refer to the screenshot given below:

7. Your OSSEC Agent is Stopped.
How to Start OSSEC Server using command line
1. To Start the linux OSSEC Server which is preconfigured on your KHIKA Aggregator you will have to go to the following directory:
/opt/ossec/bin
2. Log in to KHIKA Aggregator and become root user using the command "sudo su"
3. Go the above mentioned directory using "cd /opt/ossec/bin" command.
4. type "ls -ltrh" to list the files and directories present in the directory.
5. type following command to restart the ossec agent.
./ossec-control start
6. Refer to the screenshot given below:
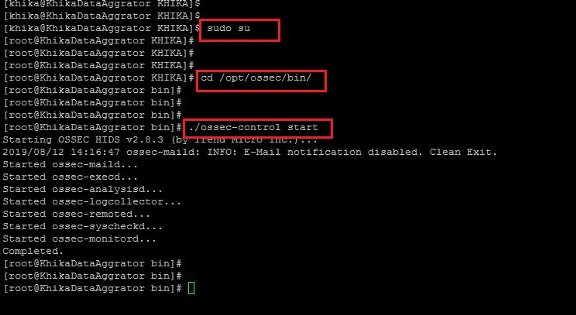
7. Your OSSEC Server is Started.
How to Start OSSEC Agent using command line
1. To Start the linux OSSEC Agent which is preconfigured on your KHIKA Aggregator you will have to go to the following directory:
/opt/ossec/bin
2. Log in to Device where ossec agent is installed and become root user using the command "sudo su"
3. Go the above mentioned directory using "cd /opt/ossec/bin" command.
4. type "ls -ltrh" to list the files and directories present in the directory.
5. type following command to restart the ossec agent.
./ossec-control start
6. Refer to the screenshot given below:

7. Your OSSEC Agent is Started.
How to Restart OSSEC Server
To restart the ossec server, You will have to peform following steps:
1. Login to the KHIKA Appserver GUI using your credentials. 2. Go to the node tab. 3. Click on Reload Configuration button to restart the OSSEC Server. 4. Refer the screenshot given below: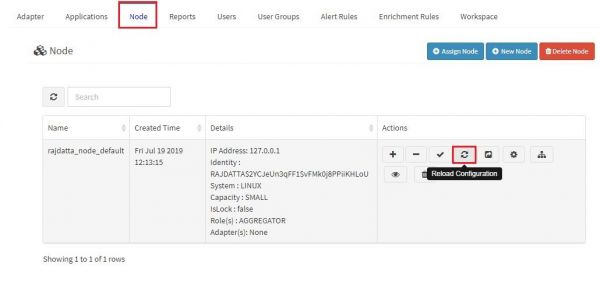
5. When Restart is done you will see a pop-up message similar to what is shown below:
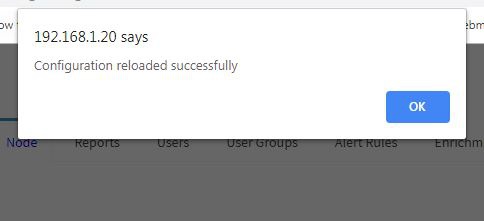
6. This is how you can Restart the OSSEC Server using KHIKA GUI. 7. If you get any error while reloading OSSEC Server, Please check if your Aggregator is connected to KHIKA AppServer.<enter link to check if the aggregator is connected to KHIKA AppServer.>
How to Restart Windows Ossec Agent
1. Open Manage Agent Application which is available in all programs or go to the following path:
C:\Program Files (x86)\ossec-agent
2. Search for win32ui in this directory and open it using Run as Administrator.
3. Please refer to the screenshot given below.

4. This will open a window as given below:

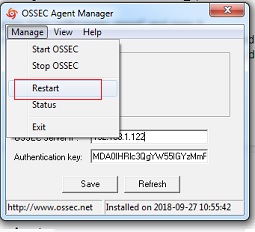
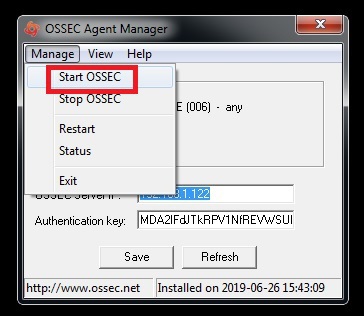
5. Click on Manage tab and then click the restart button to restart the ossec agent.
Note : We must open the Ossec Agent Application using run as administrator.
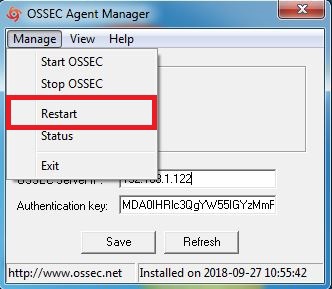
6. This operation will restart the windows ossec agent.You can refer to the below screenshot.
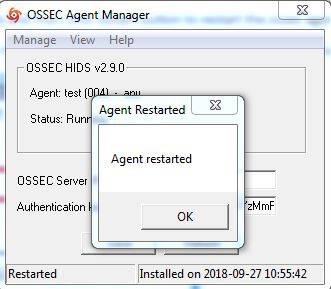
7. Done
How to Restart Linux Ossec Agent
1. To restart the linux ossec agent installed on your linux you will have to go to the following directory:
/opt/ossec/bin
2. Become root user using the command "sudo su"
3. Go the the above mentioned directory using "cd /opt/ossec/bin" command.
4. Type " ls -ltrh " to list the files and directories present in the directory.
5. Type following command to restart the ossec agent.
./ossec-control restart
6. Refer to the screenshot given below:
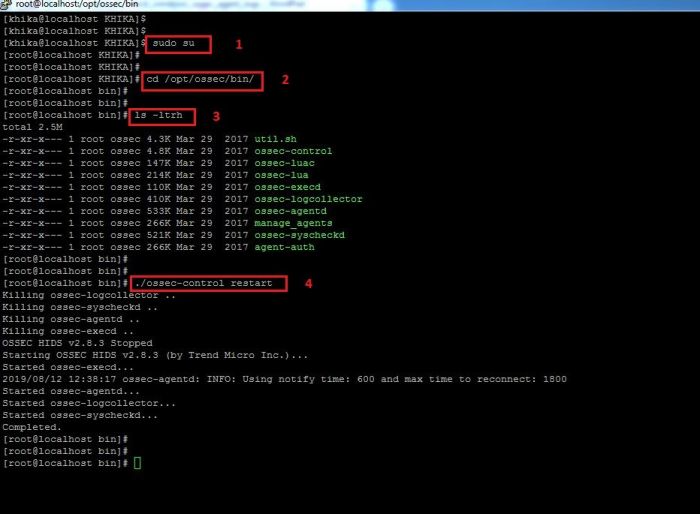
7. Your ossec agent is restarted.
KHIKA Disk Management and Issues
In KHIKA there are generally three kinds of partitions
1. root (/) partition which generally contains appserver + data.
2. Data (/data) partition contains index data which include raw data indices, reports and alerts.
3. Cold/Offline data (/offline) partition which is generally NFS mounted partition.
And this type of partition contains offline i.e. archival data which is not searchable.
To find out which partition is full use following commands
   1. df -kh
      above command will give you disk space utilization summary according to partitions.
   2. du -csh * or du -csh /data
      above command will give directory wise space usage summary.
Most probable reasons why Disk is Full :
- Size of indexes, representing raw logs grows too much.
- Log files of KHIKA processes does not get deleted (log files of KHIKA processes are huge)
- Postgres database size get increases (when you store too many reports, alerts etc)
- Report's files does not get archived(Reports are CSV and are stored as separate indexes)
- Raw log files does not get archive and deleted for ossec and syslog device(ossec raw files are big, so are syslogs)
- Cold/Offline storage partition gets full or get unmounted(which means, a snapshot of hot data can't happen).
- Elasticsearch snapshot archival utility not working properly (which means, a snapshot of hot data can't happen).
Size of indexes representing raw logs grows too much
The goal is to find the index that eats up maximum space.
Find out from which data source you are getting more logs using a utility like dev tools (you need to be KHIKA Admin to access dev tools)
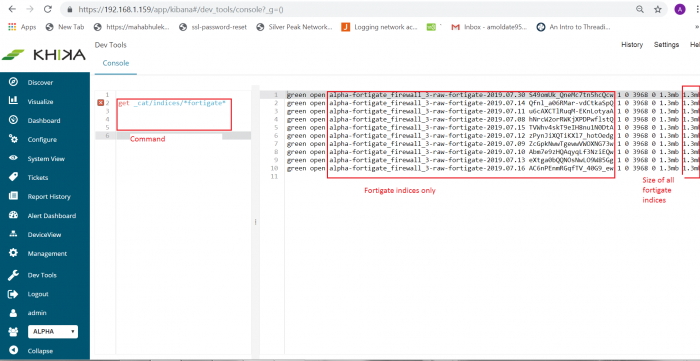
Use following commands to find out disk space usage accordingly indices
1. GET _cat/indices
Above command will give all indices (see below screenshot). This command will give outputs as index name, size, number of shards, its current status like green, yellow, red, etc.
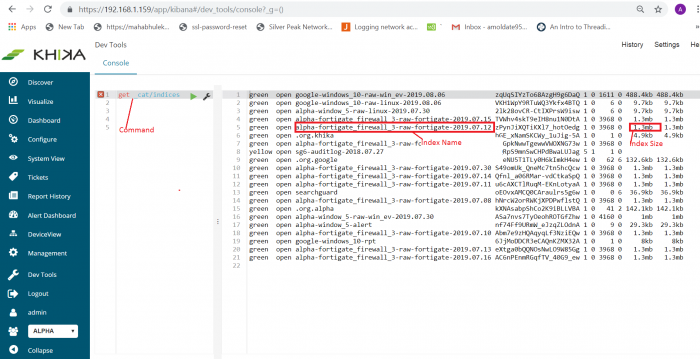
For example, if you want to find out indices only for FortiGate data source use command like
2. GET _cat/indices/*fortigate*
This command will give only FortiGate data source indices along with its name, status, size, etc. See below screenshot for reference.
If you find that disk space is utilized due to raw indices
1. Make sure that the data retention period (TTL) is reasonable. You can check it by going to "Workspace" settings and modify TTL if required. Go to "Workspace" tab from "Configure" in left menu and modify it if required.
configure -> Modify this workspace -> Data Retention -> Add required data retention ->save
2. Archive some data using snapshot archival utility from this current partition into cold data( kindly refer steps how to configure it). Note that Archival needs space on the cold-data destination.
3. If there is no option to free disk space then delete old large indices.Let say if you want to delete index “alpha-fortigate_firewall_3-raw-fortigate-2019.07.30” then use the following command in dev tools (You must be a KHIKA Admin )
   i.  POST alpha-fortigate_firewall_3-raw-fortigate-2019.07.17/_close
   ii. DELETE alpha-fortigate_firewall_3-raw-fortigate-2019.07.17
Log files of KHIKA processes not deleted
If you found process log files are not getting deleted :
1. Use following command to find out disk usage of log files. Log files stored as *.log extention.
sudo find /opt/KHIKA/ -iname "*.log" -type f | grep -v kafka | xargs du -hs | sort -rh
above command will give the output of filename and it's size (see below screenshot)
2. Use command rm to remove files.
for example, to remove file “/opt/KHIKA/alertserver/log/alertserver_debug_2336.log” use below command.
rm -rf /opt/KHIKA/alertserver/log/alertserver_debug_2336.log
3. Make sure log file clean up cronjob is working (/opt/KHIKA/UTILS/manage_logs.sh)
To check cronjob use following command
# crontab -l, this will give output as follow.

Here, the clean-up cron job is configured every day at 7 am.
4. If any directory entry is missing from clean-up cronjob then add it into "/opt/KHIKA/UTILS/manage_logs.sh"
Steps to add missing entry
   • vi /opt/KHIKA/UTILS/manage_logs.sh
   • Enter in insert mode by pressing “i” on keyboard.
   • Add missing entry. Let say “/opt/KHIKA/collection/log” directory is missing then add it's entry to delete log file which is older than 7 days as follows
     find /opt/KHIKA/collection/log -mtime +7 -delete
   • Press key “Esc” to enter in command mode.
   • Press  key “:wq” to save and exit.
5. On aggregator node make sure following properties is set to "false" in "/opt/KHIKA/collection/bin/Cogniyug.properties" file.
remote.dontdeletefiles = false
Open file opt/KHIKA/collection/bin/Cogniyug.properties using common editor like vi/vim , add property and then save and exit.
If property “remote.dontdeletefiles” is not set to “false”, Aggregator will create .out and .done file in directory “/opt/KHIKA/collection/Collection” and “/opt/KHIKA/collection/MCollection” and will never delete it. This will eat up space on aggregator. Setting property to false will delete the .out and .done files
Postgres database size has increased
Using a utility like du -csh, if you found Postgres data directory(/opt/KHIKA/pgsql/data) is taking more space then find out which table is taking more space using following steps :
1. To execute SQL command, you will need access of PostgreSQL console. To get access of PostgreSQL use following commands in order shown :
   • . /opt/KHIKA/env.sh
   • psql -d khika_db -U khika  -W
   • after entering above command it will prompt for password .Enter the password
2. Use the following SQL command.
SELECT relname as "Table", pg_size_pretty(pg_total_relation_size(relid)) As "Size", pg_size_pretty(pg_total_relation_size(relid) - pg_relation_size(relid)) as "External Size" FROM pg_catalog.pg_statio_user_tables ORDER BY pg_total_relation_size(relid) DESC limit 10;
Above SQL command will return top 10 tables which are occupying the most disk size. Generally but not necessarily, it will return the following tables.
• collection_statistics
• collection_samples
• moving_avg_sigma
• alert_details
• and report related tables
3. Lets say if you found that collection_statistics table is taking more space, then delete data from a table from which is less than the 2018 year's and Use SQL command
delete from collection_statistics where date_hour_str <= '2018-12-31';
OR, if you want to delete from collection_samples table then use the following command
delete from collection_samples where date_string <='2018-12-31';
OR, if you want to delete data from table moving_avg_sigma then use the following command
delete from moving_avg_sigma
OR, if you want to delete data from alert_details table then use the following SQL commands. (Note: it is recommended that keep alerts data at least for three years).For example, delete before the year of 2015 then use following commands
   1. delete from alert_source_device_mapping where alert_id in (select alert_id from alert_details where dtm <=( SELECT EXTRACT(epoch FROM TIMESTAMP '2015-12-31')));

   2. delete from alert_device_mapping where alert_id in (select alert_id from alert_details where dtm <=( SELECT EXTRACT(epoch FROM TIMESTAMP '2015-12-31')));

   3. delete from alert_status_audit where alert_id in (select alert_id from alert_details where dtm <=( SELECT EXTRACT(epoch FROM TIMESTAMP '2018-12-31')));

   4. delete from alert_details where dtm <=( SELECT EXTRACT(epoch FROM TIMESTAMP '2015-12-31'));
NOTE: if you found any other tables which are not in step (2) then contact an administrator.
Report's files does not get archived
Reports CSV files get stored at location "/opt/KHIKA/appserver/reports" and "/opt/KHIKA/eserver/reports" If you have found that above mentioned directories is taking more space, then do following steps :
1. Make sure archival cron is configured for reports (/opt/KHIKA/UTILS/manage_logs.sh)Use following command to check cron
crontab -l
2. Make sure the following entries are present in file /opt/KHIKA/UTILS/manage_logs.sh
   • find /opt/KHIKA/appserver/reports -mtime +7 -type f | xargs gzip

   • find /opt/KHIKA/tserver/reports -mtime +7 -type f | xargs gzip

   • find /opt/KHIKA/eserver/reports -mtime +7 -type f | xargs gzip
If above entry is missing then add it using common editor like vi or vim.
3. If reports are too old and there is no option to free disk space then delete the reports. Use the following commands to delete report files which are older than 1 year
   • find /opt/KHIKA/appserver/reports  -type f -mtime +365 -delete

   • find /opt/KHIKA/tserver/reports  -type f -mtime +365 -delete

   • find /opt/KHIKA/eserver/reports  -type f  -mtime +365 -delete
Raw log files does not get archive and deleted for ossec and syslog device
On Aggregator node, Raw logs are stored at "/opt/ossec/logs/archives" for Ossec devices and "/opt/remotesyslog" for Syslog devices. On Aggregator by default we keep raw logs only for three days. If you find raw logs more than three days then delete it and configure cron job for the same. Add following cronjob "/opt/KHIKA/UTILS/manage_rawdata_logs.sh"
Steps to add a cronjob
1. login as user khika on KHIKA Aggregator server. 2. Enter crontab -e command. 3. Add following entry “* */2 * * * /opt/KHIKA/UTILS/manage_rawdata_logs.sh >/dev/null 2>&1” to run cronjob every 2 hour.4. Press “ESC” key 5. Press key “:wq” to save and exit.

Cold/Offline storage partition gets full or unmounted
If cold/offline storage partition gets full
Every organization keeps cold data according to their data retention policy (1 year, 2 years, 420 days, etc). If there is data which is more than organization policy data retention period then delete it.
To delete data use following command
find location -iname “*.tar.gz”-type f -mtime +days -delete
For example, Let say offline storage location is “/opt/KHIKA/Data/offline” and the retention period is 420 days then use the following command to delete data.
find /opt/KHIKA/Data/offline/ -iname “*.tar.gz” -type f -mtime +420 -delete
The cold data is typically stored on cheaper storage and is mounted using NFS. Sometimes, nfs storage partition gets unmounted
1. If you know the NFS server and its shared location then refer the following command to mount it again
mount -t nfs 192.168.0.100:/nfsshare /mnt/nfsshare
where "192.168.0.100" is nsf server and "/nfsshare" is share location and "/mnt/nfsshare" is mount point.
2. Contact server administrator to mount offline storage
Elasticsearch snapshot archival utility not working properly
Elasticseacrh Snapshot utility raises an alert when it fails to snapshot.
Alert status is "archival_process_stuck"
Alert status message "archival_process_stuck" indicates that the process is taking more than 24 hours for a single bucket. This may happen due to a script is terminated abnormally or compression operation is taking more time. Check logs and find an issue. find the current state of recent archival and change it accordingly. To change the current state of archival you will need PostgreSQL access use following command
   To get access of PostgreSQL

   1. . /opt/KHIKA/env.sh
   2. psql -d khika_db -U khika  -W


   3. After enetring above command it will prompt for password .Enter the password.
1. If archival bucket state is "COMPRESSING", "COMPRESSING_FAILED", then make its state as "SUCCESS" use following SQL command
NOTE: Before updating Find out required id of the record in table use following SQL command
1. select id from application_transformerarchivalaudit where status in ('COMPRESSED' ,'COMPRESS_FILE_MOVE_FAILED')
Above command will return id, use this in next subsequent command. Let say command return id as 1.
2. update application_transformerarchivalaudit set status='SUCCESS' where id =1
2. If archival bucket state is "COMPRESSED", "MOVING_COMPRESSED_FILE" or "COMPRESS_FILE_MOVE_FAILED" then move archival to offline storage (if available ) and update it's state to "COMPLETED"
NOTE: Before updating Find out required id of the record in table use following SQL command
1. select id from application_transformerarchivalaudit where status in ('COMPRESSED','MOVING_COMPRESSED_FILE','COMPRESS_FILE_MOVE_FAILED')
Above command will return id and use this in next subsequent command. Let say command return id as 1.
2. update application_transformerarchivalaudit set status='COMPLETED' , repo_path="location_where_archival_move" where id =1
In above command "location_where_archival_move” is an offline storage path where archival is manually move.
For example, If you move archival “/opt/SNAPSHOT/ALPHA/2019/Jul/WINDOW_5/20190730.tar.gz" to offline storage /opt/ES_BACKUP/ALPHA/2019/Jul/WINDOW_5/20190730.tar.gz" then location_where_archival_move will be “/opt/ES_BACKUP/ALPHA/2019/Jul/WINDOW_5/20190730.tar.gz”
3. If the archival state in "RESTORE_ARCHVAL_COPYING", "RESTORE_ARCHIVAL_COPY_FAILED", "RESTORE_ARCHIVAL_READY_TO_DECOMPRESS", "RESTORE_ARCHIVAL_DECOMPRESSING", "RESTORE_ARCHIVAL_DECOMPRESS_FAILED" then try to reschedule restore snapshot by making it's state to "RESTORE_ARCHVAL_SCHDULED"
NOTE: Before updating Find out required id of the record in table use following SQL command.
1. select id from application_transformerarchivalaudit where status in ('RESTORE_ARCHVAL_COPYING','RESTORE_ARCHIVAL_COPY_FAILED,'RESTORE_ARCHIVAL_READY_TO_DECOMPRESS','RESTORE_ARCHIVAL_DECOMPRESSING','RESTORE_ARCHIVAL_DECOMPRESS_FAILED')
Above command will return id and use this in next subsequent command. Let say command return id as 1.
2. update application_transformerarchivalaudit set status='RESTORE_ARCHVAL_SCHDULED' where id =1
4. If the archival state is "RESTORE_ARCHIVAL_FAILED" then try to reschedule "RESTORE_ARCHVAL_SCHDULED" if again it gets failed then make it's state as "RESTORE_ARCHIVAL_NOT_AVAILABLE".
NOTE: Before updating Find out required id of the record in table use following SQL command.
1. select id from application_transformerarchivalaudit where status in ('RESTORE_ARCHIVAL_FAILED')
Above command will return id and use this in next subsequent command. Let say command return id as 1.
   2. update application_transformerarchivalaudit set status='RESTORE_ARCHVAL_SCHDULED' where id =1
      OR
      update application_transformerarchivalaudit set status='RESTORE_ARCHIVAL_NOT_AVAILABLE' where id =1
alert status is "archival_failed"
If the alert status is "archival_failed" and event is "archival process failed reach max retries".It means that snapshot archival process reached maximum retries and hence it will not launch the next snapshot. Please check the logs.
1. If snapshot archival failed due to connection error make its state as "SCHEDULED"
1. select id from application_transformerarchivalaudit where status in ('FAILED')
Above command will return id and use this in next subsequent command. Let say command return id as 1.
2. update application_transformerarchivalaudit set status='SCHEDULED' where id =1
2. If snapshot get failed due to shards failed then make its state as "SCHEDULED" and after rescheduling snapshot again if it gets failed then either delete bucket entry from a table or make its state as INDEX_NOT_FOUND
1. select id from application_transformerarchivalaudit where status in ('FAILED')
Above command will return id and use this in next subsequent command. Let say command return id as 1.
   2. update application_transformerarchivalaudit set status='SCHEDULED' where id =1
      OR
      update application_transformerarchivalaudit set status='INDEX_NOT_FOUND' where id =1
      OR
      delete from application_transformerarchivalaudit where id=1
Elasticsearch Snapshot functionality configuration
Elastisearch snapshot functionality is nothing but data archival functionality. Configuration To Configure snapshot /restore functionality you need to configure following things 1. ElasticSearchSnapshotRestoreUtils.sh 2. EsArchivalCron.sh 3. TLHookCat.py 4. elasticsearch_archival_process_failed alert
Configuration of ElasticSearchSnapshotRestoreUtils.sh
Functionality of ElasticSearchSnapshotRestoreUtils.sh is to take snapshot set in “Time to Live” ( TTL ) parameter of the workspace also restore snapshot whenever necessary.
To configure “ElasticSearchSnapshotRestoreUtils.sh” you need to set the following properties
1. path.repo
Need to put this property in elasticsearch configuration file “/opt/KHIKA/elasticsearch/config/elasticsearch.yml”
Use a common editor like vim/vi to edit the configuration file (see below screenshot)

here path.repo is “/opt/KHIKA/Data/offline”
Please Note: If you have configured a multi-node cluster, then the property path.repo should be same on all nodes or this file should exist on a shared location accessible to all the nodes.
Please Note: After configuration of path.repo property in elasticsearch.yml then please
restart all elasticsearch node which is within cluster.
2. snapshot_base_repo_path
Need to put property ‘snapshot_base_repo_path’ in “/opt/KHIKA/Cogniyug.ini” file. The value of this property should same as ‘path.repo’ set in elasticsearch.yml file in step 1.
Use an editor like vi/vim to set the property (see below screenshot)

3.delete_index_after_snapshot
Need to put this property in “/opt/KHIKA/Cogniyug.ini” file.
This property tells whether to delete indices after taking a snapshot. If the value of delete_index_after_snapshot=yes then it will delete index after the snapshot is stored in snapshot_base_repo_path. If the value of delete_index_after_snapshot=no then it will not delete the index.
Edit the file like shown below in the screenshot

After configuration above properties (1,2 &3 ) Please configure cronjob for script ElasticSearchSnapshotRestoreUtils.sh. Add following entry in cronjob
*/15 * * * * /opt/KHIKA/UTILS/ESTools/ElasticSearchSnapshotRestoreUtils.sh >> /opt/KHIKA/UTILS/ESTools/Cron_ElasticSearchSnapshotRestoreUtils.log 2>&1
Follow below steps to add a cronjob
   1. login as user khika on server.
   2. Use command crontab -e
   3. Enter key “i”  for insert mode
   4. Add below entry( See screenshot )


      here cronjob scheduled for every fifteen minutes
   5. press key “:”+”w”+”q” to save and exit (same as your would save file in vi editor)
Configuration of EsArchivalCron.sh
The functionality of EsArchivalCron.sh is
1. Compressing the snapshot taken in the above step.
2. Move the compressed snapshot to offline/cold storage if it is provided.
3. Check the integrity of archival on a daily basis.
To configure EsArchivalCron.sh need following properties
1. archival_loc (optional)
This is an optional property
If you want to move archival snapshots to some other offline/cold storage then use this property.
If you don’t want to move archival snapshot to some other storage then don’t add this archival_loc property.
This property should be added in section ELASTICSERVER of “/opt/KHIKA/Cogniyug.ini” file (See below screenshot)

Here archival_loc is set to /opt/ES_BACKUP
After configuration of the above optional property please add the following cronjob
*/10 * * * * /opt/KHIKA/UTILS/ESTools/EsArchivalCron.sh >> /opt/KHIKA/UTILS/ESTools/Cron_EsArchivalCron.log 2>&1
See the following steps to add a cronjob
   1. Login as user khika on server

   2. Use command crontab -e

   3. Enter key “i”  for insert mode.

   4. Add below entry (See below screenshot)


      here cronjob scheduled for every ten minutes.

   5. Press key “:”+”w”+”q” to save and exit (just like saving and quitting vi editor)
TLHookCat.py
You will need to configure TLHookCat.py to consume KHIKA formatted logs. This KHIKA formatted logs generated by EsArchivalCron.sh and ElasticSearchSnapshotRestoreUtils.sh utility. This logs are necessary to generate an alert if something goes wrong with Snapshot and Restore functionality.
Configure adapter script “/opt/KHIKA/Apps/Adapters/TLHookCat/TLHookCat.py” inside SYSTEM_MANAGEMENT Workspace
(Please refer Working with KHIKA Adapters to configure custom adapter)
After configuration of a TLHookCat.py please add the following entry in its configuration file which is located at “/opt/KHIKA/Apps/Adapters/TLHookCat/” and filename will be “config_SYSTEM_MANAGEMENT_<Adapter name >_LOCALHOST.csv”
(here <Adapter name> is the name of adapter that you added while doing customer adapter configuration)
Entry to add in configuration file config_SYSTEM_MANAGEMENT_<Adapter name >_LOCALHOST.csv
/opt/KHIKA/UTILS/ESTools,2.*.log$,NONE,NONE
elasticsearch_archival_process_failed alert
This is an alert rule which raise an alert if something goes wrong with elasticsearch snapshot functionality. This alert is already configured just check whether it is active or not to check please follow below steps and go to
configure -> Alert Rules -> select elasticsearch_archival_process_failed -> Modify ->Select Active checkbox -> Submit
Check Status of Snapshot / Restore Functionality
On KHIKA web console you will able to check status of Snapshots.Please go to
Configure -> Workspace -> Archival Status Audit -> Select Date Range -> Run
After following above steps you will see snapshot status within a selected date range (see below screenshot)
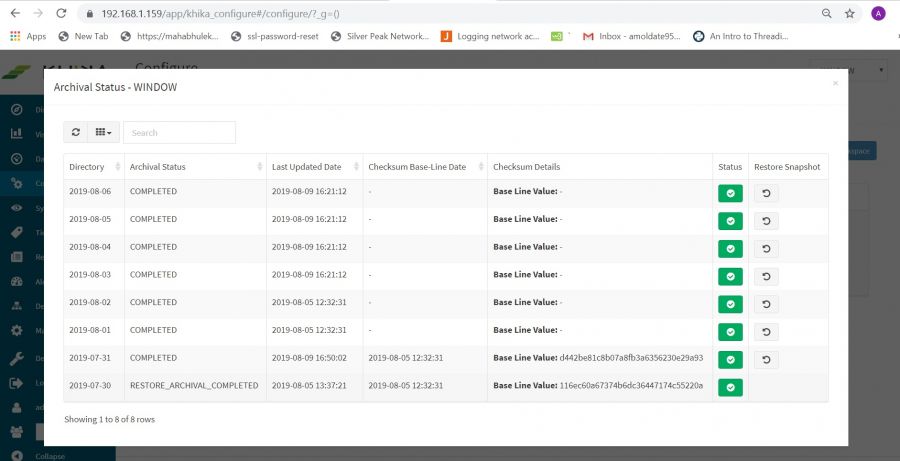
Above the screenshot, you will see the following columns
1. Directory
This show bucket date i.e index day that has been considered for Snapshot.
2. Last Updated Date
This shows last updated time to it’s corresponding state .
3. Checksum Base-Line Date
This shows the checksum baseline date of archival. When snapshot completed through its archival cycle then it’s checksum will be calculated. This help to identify data tampering (if someone tries to modify archival )
4. Checksum Modified Date
If baseline checksum modified then this column shows a date of modification.
5. Checksum Details
This column shows baseline checksum (old checksum) and new checksum (if checksum modified).
6. Restore Snapshot
This column shows action for the user if want to restore snapshot or cancel schedule for a restored snapshot.
7. Archival Status
This column shows the current status of the snapshot/bucket. Please see the following status of the snapshot
restore process (point a and point b)
Snapshot status
While taking snapshot there are some intermediate state which is given below.
NOTE: If there are any jobs with status “RESTORE_ARCHVAL_SCHDULED” Then script will give priority for restoration of the snapshot. User has to wait until all restored archival job to be finished.
1. SCHEDULED
SCHEDULED status means snapshot has been scheduled for that particular date.
2. INDEX_NOT_FOUND
Before scheduling snapshot utility check for index availability on that particular bucket day/date (according to TTL of the workspace). If index not found for that particular bucket day/date then it’s status mark as INDEX_NOT_FOUND.
3. IN_PROGRESS
This state means elastic snapshot is currently running.
4. SUCCESS
SUCCESS means snapshot finished and all shards were stored successfully.
5. FAILED
The snapshot finished with an error and failed to store any data.
6. COMPRESSING
After SUCCESS state of the snapshot, the COMPRESSING state comes into the picture. This state usually takes a long time for compressing.
7. COMPRESSED
After state COMPRESSING into the state will be COMPRESSED. It means that snapshot compressing done successfully.
8. COMPRESSING_FAILED
If something goes wrong while doing COMPRESSING snapshot then it states mark as COMPRESSING_FAILED.
9. MOVING_COMPRESSED_FILE
After state COMPRESSED if the user has configured to move archival snapshot to some offline/cold storage then it state MOVING_COMPRESSED_FILE appear while moving.
10. COMPRESSE_FILE_MOVED
Snapshot archival file move successfully to offline/cold storage.
11. COMPRESS_FILE_MOVE_FAILED
Failed to move COMPRESSED snapshot to offline/cold storage.
12. CHECKING_INTEGRITY
Checking integrity of snapshot archival. Here md5 checksum is calculated for archival.
13. CHECK_INTEGRITY_FAILED
This state means something goes wrong while calculating md5 checksum.
14. COMPLETED
After calculating md5 checksum successfully snapshot archival state mark as COMPLETED. This means the snapshot archival cycle has been completed.
Restore Snapshot status
There are some intermediate state while doing restoration of the snapshot which is given below.
If there currently any snapshot is running then the script will wait for to finish it and then restoration process will begin
1. RESTORE_ARCHIVAL_SCHDULED
This state means archival snapshot has been scheduled for restoration.
2. RESTORE_ARCHIVAL_NOT_AVAILABLE
This state means that snapshot archival not available on the designated location. This state specifies there is no way to restore the snapshot.
3. RESTORE_ARCHIVAL_COPYING
This RESTORE_ARCHIVAL_COPYING state means archival snapshot file is copying from offline/cold storage to registered snapshot repository location.
4. RESTORE_ARCHIVAL_COPY_FAILED
This state means failed to copy snapshot archival file from offline/cold storage to registered repository location.
5. RESTORE_ARCHIVAL_READY_TO_DECOMPRESS
This state means the snapshot archival file successfully copied from offline/cold storage to registered snapshot repository location.
6.RESTORE_ARCHIVAL_DECOMPRESSING
This state show that snapshot archival file is decompressing.
7. RESTORE_ARCHIVAL_DECOMPRESS_FAILED
This state means failed to decompress snapshot archival file. This may happen due to corrupt snapshot archival filename .
8.RESTORE_ARCHIVAL_INIT
RESTORE_ARCHIVAL_INIT snapshot restoration is in INIT state but not started.
10.RESTORE_ARCHIVAL_INDEX
This state means Reading index meta-data and copying bytes from source to destination.
11.RESTORE_ARCHIVAL_START
Restoration of the snapshot has been started.
12. RESTORE_ARCHIVAL_FINALIZE
Restoration has been done and doing some cleanup.
13. RESTORE_ARCHIVAL_DONE
Restoration of snapshot completed and data available to the user for searching and aggregation.
What to do if something goes wrong for snapshot restore functionality
Elasticsearch Snapshot utility raises an alert when it fails to take a snapshot. To restore snapshot functionality please check here.
How to Reinstall OSSEC Agent for Windows
1. Go to the following path in your windows server:
Control Panel -> All Control Panel Items -> Programs and Features
2. Select the OSSEC HIDS Application and then click on uninstall.
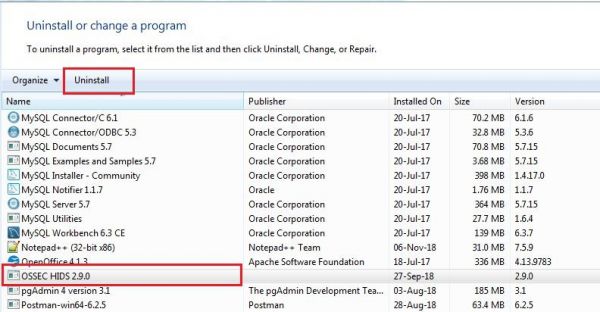
3.Follow the procedure of uninstallation. Please refer to the screenshots below:
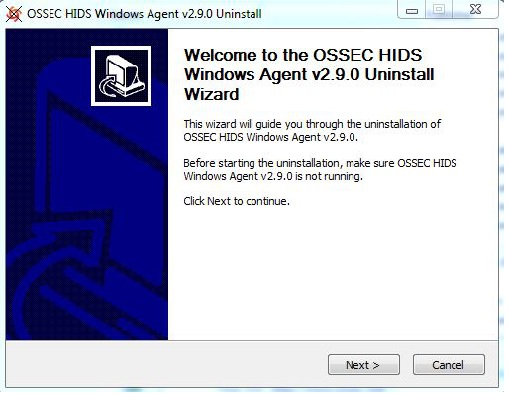
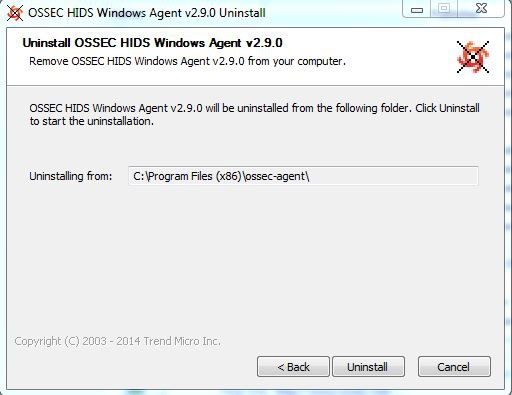
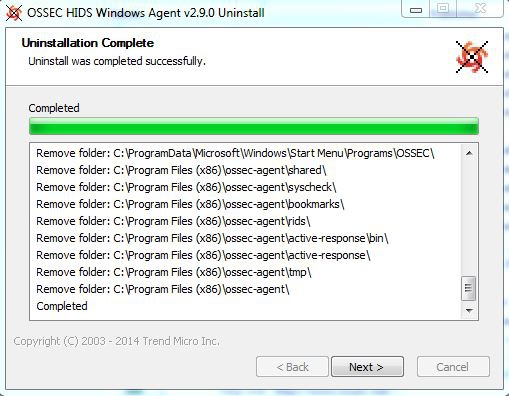
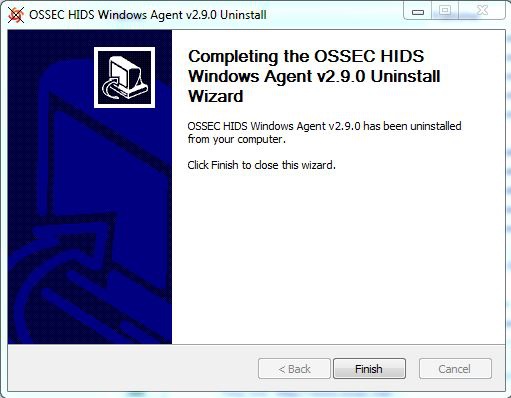
4. Uninstallation of windows ossec agent is Done
5. Now we will install the OSSEC Agent once again.
Note: Please make sure you use an administrator account to install the OSSEC Agent.
6.Install ossec agent for Windows
How to Reinstall OSSEC Agent for Linux
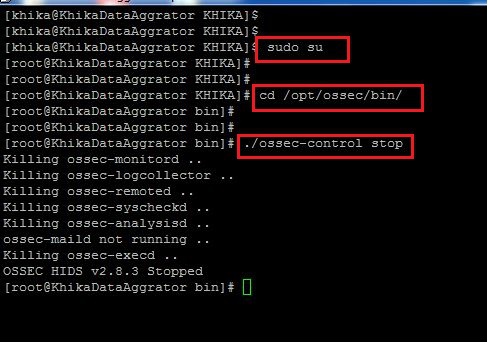
1. To reinstall the ossec agent for linux, We must first uninstall the ossec agent which is already present on your linux server. 2. Login to your Ossec Agent. 3. Fire sudo su command to enter into root. 4. Before proceeding to the uninstallation, make sure you stop the ossec agent. 5. Go to the following directory: 6. /opt/ossec/bin 7. Fire ./ossec-control stop command to stop the agent.
8.
9. Go to the directory where ossec agent gets installed, (/opt) 10. Type following command 11. cd /opt 12. Remove the ossec directory using following command. 13. rm -rf ossec/
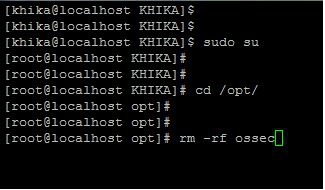
14. Now proceed with installing the ossec agent again. 15. Install ossec agent for Linux

