KHIKA App for Apache WebServer
Contents
- 1 Introduction
- 2 How to Install the KHIKA App for Apache WebServer?
- 3 How to get your Apache Webserver data into KHIKA ?
- 4 Installing OSSEC Agent for Apache Server
- 5 Adding the device in the Adaptor
- 6 Extract key from KHIKA OSSEC Server
- 7 Insert unique OSSEC key in OSSEC Agent on the Linux Server
- 8 Reload Configuration
- 9 Verifying OSSEC data collection
- 10 How to check the output of KHIKA Apache WebServer App ?
- 10.1 Webserver Http Error Status Dashboard
- 10.2 Webserver Top N URLs Dashboard
- 10.3 Webserver Total Request Per Client IP Dashboard
- 10.4 Webserver Traffic Categorization Dashboard
- 10.5 Webserver Top N Referrers Dashboard
- 10.6 Report_Webserver_Referrer_Detail Dashboard
- 10.7 KHIKA Alerts for Apache WebServer
Introduction
Apache Webserver runs critical business applications in organisations. Monitoring them is important, from both security and operational standpoint.
With KHIKA App for Apache Webserver, you can :
- Monitor hundreds of servers at one central place.
- Analyse http error status for accessed URLs on your server.
- Can see information like top accessed URL and count of hits on your server.
- Monitor client IP wise total requests on your servers.
We explain below steps to configure and interpret the output of KHIKA App for Apache Webserver. The key parts to get here are :
- Install the KHIKA App for Apache Webserver
- Get data from your Apache Webserver into KHIKA Aggregator
How to Install the KHIKA App for Apache WebServer?
It is assumed, that you have already configured KHIKA Data Aggregator in your environment. If not, please read how to configure KHIKA Data Aggregator and perform the pre-requisite steps.
This section explains how to pick and install the KHIKA application for Apache WebServer. Installing the application shall put together and activate the adapter (parser) that can handle the webserver data format, the dashboards and the alert rules which are preconfigured.
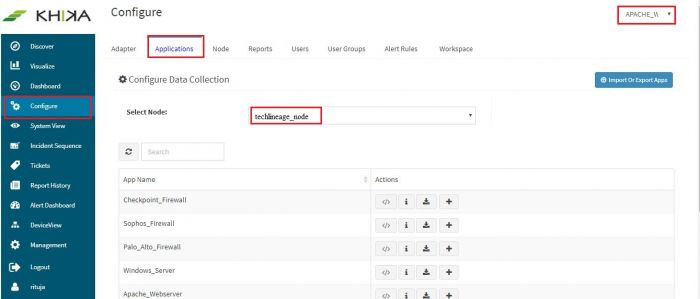
Go to “Applications” tab in the “Configure” menu.
Check whether the appropriate Workspace is selected. Note: Application is always loaded in a Workspace. Read the section on Workspaces to know more about KHIKA Workspaces. Also select your KHIKA aggregator name in the Node dropdown. This is to ensure that we are collecting data from the desired source and into the correct workspace which is ready with the configured application and components.
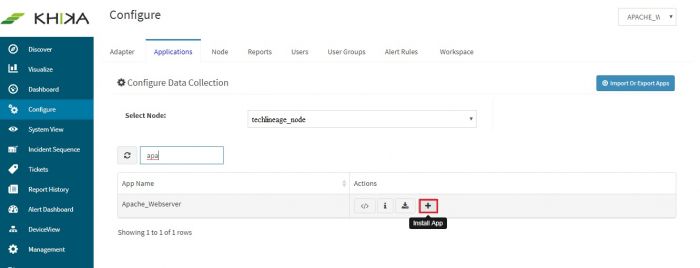
Click on the “+” button. A pop up appears.
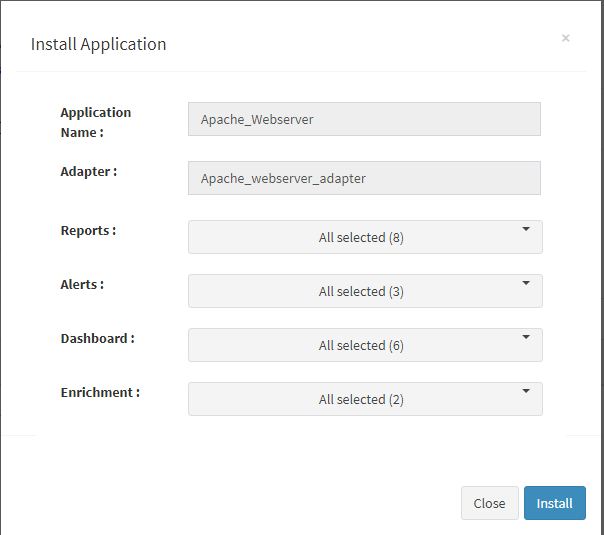
Users can now select the contents of the application required. For example, on the dropdown for “Reports”, click to expand it. List of all reports can be seen. User can individually select the reports required by checking on the checkbox next to each. Alternatively, check on “Select All” option to get all of them. Similarly you can select contents from Alerts and Dashboards.
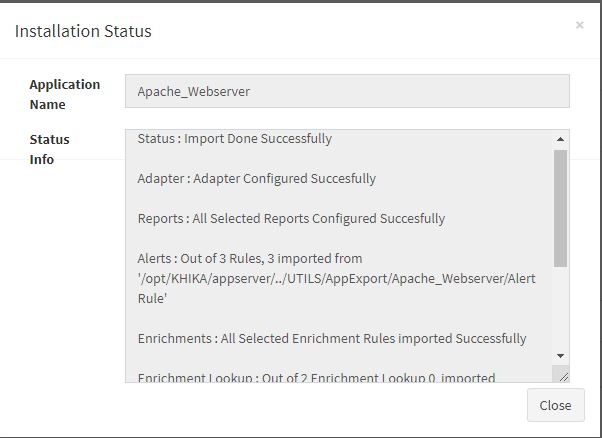
Click “OK” to proceed with the installation of the selected Application. After successful installation, following status should be displayed :
This simple procedure to install a KHIKA App, automatically configures the Adapter (required for parsing the data from raw syslogs), calculated KHIKA reports on raw data, Visualizations, Dashboards and Alerts – all in one click.
How to get your Apache Webserver data into KHIKA ?
KHIKA recommends, popular open source OSSEC integration to monitor the Apache webservers. There are 2 components in OSSEC Integration with KHIKA.
- OSSEC Agent – Installed on each webserver which we wish to monitor
- OSSEC Server – Present on KHIKA Data Aggregator
The OSSEC agent and server communicate with each other using a unique key pairing mechanism. The main steps to start getting data from a Linux server are :
- Install Ossec agent on the webserver (for Linux)
- Add the webserver details in KHIKA
- Extract a unique key for this device from KHIKA
- Insert this key in the Ossec agent (ie. on respective webserver to be monitored)
- Reload Configuration
- Verify data collection
Each of these steps is explained in detail in the further sections.
Installing OSSEC Agent for Apache Server
Download Linux Ossec Agent from here.
For Linux Agent, Please check your OS version and select appropriate downloader file.
Version 5: ossec_TL_Agent_5.11.tar.gz
Version 6: ossec_TL_Agent_6.x.tar.gz
Version 7: ossec_TL_Agent.tar.gz
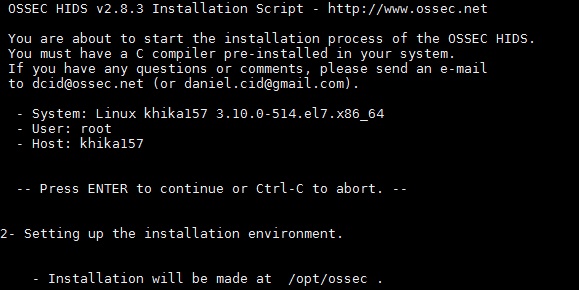
Copy the downloaded installer on your server that you wish to monitor using KHIKA and run the installer with "root" credentials on the Server. Please Note : It is extremely important to install the OSSEC agent with "root" privileges as this agent reads the /var/log/secure, /var/log/messages and some other important files. In order to read it successfully the ossec-agent process must be installed with "root" privileges.
You will have to run the following command as "root" user to install the Ossec Agent:- Remove/rename ossec directory if already exists on the agent. ie. our Linux server.
mv /opt/ossec /opt/ossec_bak
Go to the location where you have copied the Ossec agent installer mentioned above. Extract it using the following command
tar –zxvf ossec_TL_Agent.tar.gz
Then go to that directory using the cd command. You shall see a script by the name install.sh
Then Run following command.
"sudo ./install.sh" (you need not do sudo if you have already logged in as root)
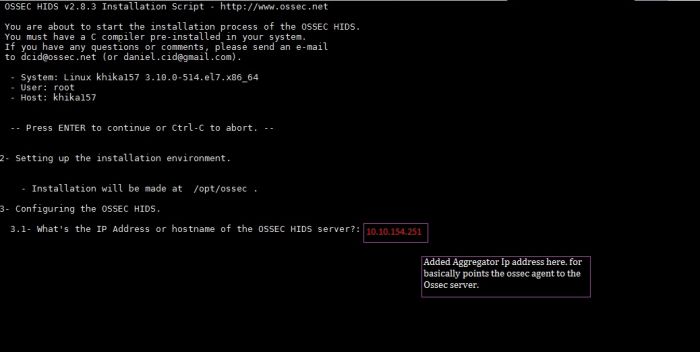
Now, add KHIKA Data Aggregator IP address (OSSEC server IP address) to point the OSSEC agent to the OSSEC server.
NOTE: You will have to repeat these steps on each of the Servers that you wish to monitor using KHIKA.
For getting apache logs we need to add the following section in agent.conf
       <localfile>
               <log_format>apache</log_format>
               <location>/var/log/httpd/access_log</location>
       </localfile>
Adding the device in the Adaptor
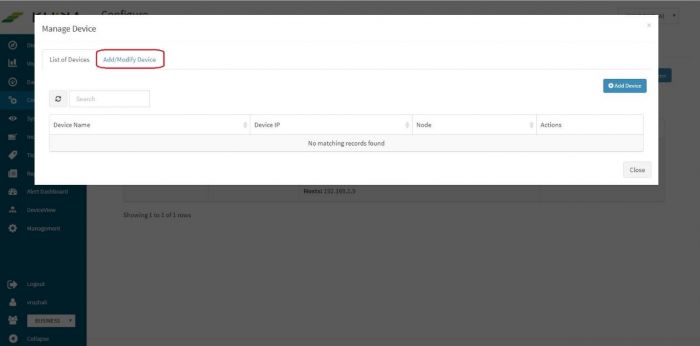
Go to Adapter tab in the “Configure” menu. Next to our “apache_webserver_adapter”, click on the “Manage Devices” icon.
Pop up appears for device details
Click on “Add / Modify Device” tab. Another pop up appears for device details.
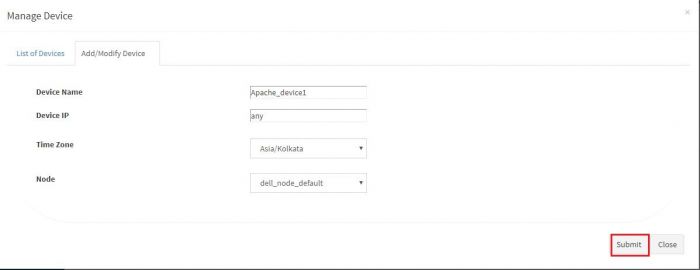
Enter the expected device name. Also, in the field for IP address, enter “any”. Please note : Always enter the IP Address as “any”. This is a safe and sure option to establish a connection with the server where we are suggesting ossec agent to use “any” of its configured IPs to be used to connect with the OSSEC Server. The device may have multiple NIC cards/IP addresses and unless we are sure of what IP will be used for connection, the connect will fail. Hence, use “any”
Select appropriate time zone of this device. In the “Node” field dropdown, select the name of the Aggregator or local data collector for this device. Click on Submit. We get a success message and device is added successfully to this adaptor.
Extract key from KHIKA OSSEC Server
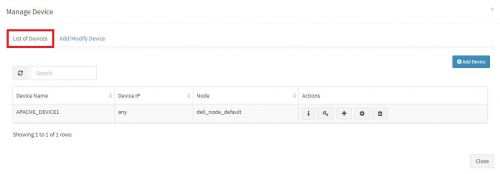
Now the expected Windows server is added in the relevant KHIKA Adapter or parser that will parse this data type. To see this device entry, click on “Manage Devices” icon next to the adaptor .
A pop up with device details of the adaptor appears. Select “List of Devices” tab.
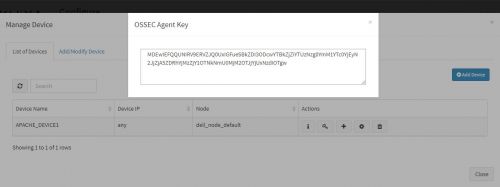
Click on the “Get OSSEC Key” icon next to this device.
This is the unique key for this device created by the OSSEC server. Paste this key in the Ossec agent which is installed on this Windows server.
Insert unique OSSEC key in OSSEC Agent on the Linux Server
Perform following simple steps on the Apache server Agent
- Login as "root" on the agent server
- Please note OSSEC Server listens on UDP port 1514 and the firewall between the ossec agent and ossec server must be open for UDP protocol and 1514 port.
- In the OSSEC Agent installation directory, run manage-agent script from
sudo /opt/ossec/bin/manage_agents
- You'll be presented with these options
Select "I" to import the key (which we created in above section, on the Ossec server)
- Copy and paste the key generated on the server
- Restart the agent using command /opt/ossec/bin/ossec-control restart
- Repeat these steps for each server to be monitored.
- Finally, go to Workspace tab and click on “Apply Configuration” icon.
Reload Configuration
Login into the KHIKA portal.
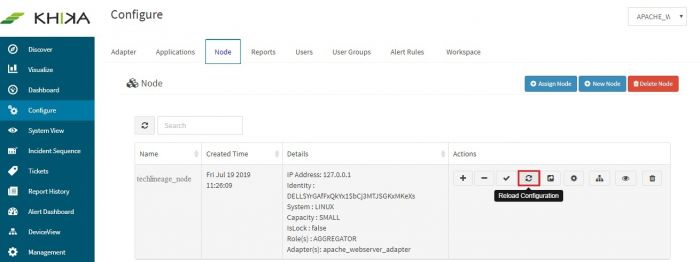
- Go to Configure
- Select workspace, eg. Apache_WebServer
- Go to Node Tab
- Click Reload Config
This step restarts OSSEC Server. Wait for a few minutes for server to restart.
Verifying OSSEC data collection
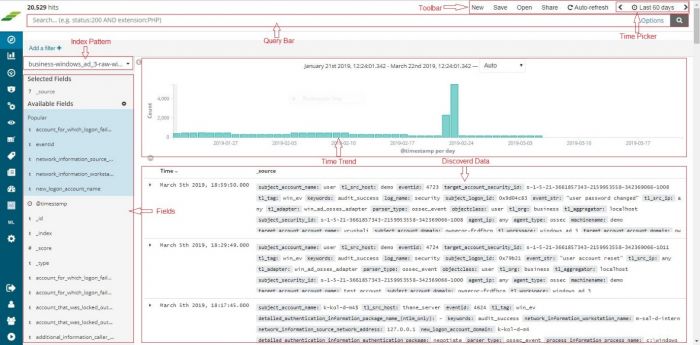
Once the device is added successfully, we can check the data for this device on Discover screen. Go to “Discover” from the main menu. Select the appropriate index for the same. Raw (khika formatted) data of all your Apache webservers added in KHIKA so far, is seen here.
To see the data for our newly added device, enter search string in lower case – tl_src_host : name_of_the_device_added_in_lower_case and click on the search icon.
How to check the output of KHIKA Apache WebServer App ?
Webserver Http Error Status Dashboard
This dashboard shows HTTP status codes for accessed URLs. This dashboard shows top 10 URLs which are accessed most, and related details like server IP and HTTP status code.
Elements in the Dashboard are explained below :
| Visualization | Description |
| Contribution of Status | This pie chart shows different types of status like 403,503. |
| Contribution of Server IP | This pie chart shows contribution of serverIP. |
| Contribution of URL | This pie chart shows different types of URL. |
| Time trend | Trend of login events over time. Useful to identify unusual spikes at a glance. X axis : date & time Y axis : count of events |
| Summary Table | Detailed data with timestamp and count |
Some suggestions for useful interaction with this dashboard could be :
- In the "Contribution of Status" pie, click and select any one status code. This shall isolate respective status code and URLs accessed for that selected serverIP and is reflected across the dashboard. i.e the other pie charts, time trends and summary table shall show filtered information for this serverIP only.
- Alternatively, in the "Contribution of Server IP" pie, click and select any one server IP. This shall isolate respective server IP and URL accessed for that selected Server IP and reflected across the dashboard.
Webserver Top N URLs Dashboard
As the name suggests, this dashboard shows top URLs and details about domain and top hits on server.
Elements in the Dashboard are explained below :
| Visualization | Description |
| Contribution of URL | This pie chart shows different types of URL accessed by server. |
| Server Name wise Request Hits | X axis : Name of Servers Y axis : Count of such request hits for each server. |
| Time trend | Trend of login events over time. Useful to identify unusual spikes at a glance. X axis : date & time Y axis : count of events |
| Contribution of Domain | This pie chart shows different types of domain. |
| Summary Table | Detailed data with timestamp and count |
Some suggestions for useful interaction with this dashboard could be :
- On the pie chart "Contribution of URL" select any one URL. This shall isolate the number of hits for requested URL and also shows server names, domain for selected URLs across the dashboard. i.e the other pie charts, time trends and summary tables shall show filtered information for this server name only.
- In the "Contribution of Domain" pie, click on any one domain, a filter gets applied on this selected domain, rest of the elements on the dashboard then show data for that domain only like URL's for this domain,server Name, etc.
Webserver Total Request Per Client IP Dashboard
This dashboard shows Top client IP and and total requests from selected client IP.
Elements in the Dashboard are explained below :
| Visualization | Description |
| Contribution of Server Name | This pie chart shows Contribution of servers. |
| Client IP wise Request | X axis : ClientIP(s) Y axis : Count of request hits for that clientIP. |
| Time trend | Trend of login events over time. Useful to identify unusual spikes at a glance. X axis : date & time Y axis : count of events |
| Summary Table | Detailed data with timestamp and count |
Some suggestions for useful interaction with this dashboard could be :
- In the graph "Client IP wise Request " , click and select any one client IP. This shall isolate the requested hits for that selected client IP and get reflected across the dashboard. i.e the other pie charts, time trends and summary table shall show filtered information for this user only.
- In the pie "Contribution of Server Name " click and select any one servername. This shall isolate the respective user and requested hits for that servername and get reflected across the dashboard.
Webserver Traffic Categorization Dashboard
This dashboard shows traffic categorization eg. DIRECT or REFERRED. Also it shows client IP wise referrer, top URLs and Servers.
Elements in the Dashboard are explained below :
| Visualization | Description |
| Server IP wise Category | X axis : ServerIP Y axis : count of Category. |
| Client IP wise Referrer | X axis : ClientIP Y axis : count of Referrer. |
| Contribution of URL | This pie chart shows Contribution of different types of URL. |
| Contribution of Server Name | This pie chart shows Contribution of server name. |
| Contribution of Referrer | This pie chart shows Contribution of different types of Referrer. |
| Time trend | Trend of login events over time. Useful to identify unusual spikes at a glance. X axis : date & time Y axis : count of events |
| Summary Table | Detailed data with timestamp and count |
Some suggestions for useful interaction with this dashboard could be :
- On the bar graph "Server IP wise Category" select any one serverIP. This shall isolate respective category and its count for selected serverIP and also domain and accessed URL for that serverIP across the dashboard. i.e the other pie charts, time trends and summary table shall show filtered information for this serverIP only.
- Inversely, in the bar graph "Client IP wise Referrer" ,click on the any one clientIP to select and rest of the elements on the dashboard then show data for that clientIP only.
Webserver Top N Referrers Dashboard
This dashboard shows top referrers.Also gives the details of domain and top hits on server.
Elements in the Dashboard are explained below :
| Visualization | Description |
| Contribution of Domain | This pie chart shows contribution of different types of Domain. |
| Server Name wise Hits | X axis : ServerName(s) Y axis :servername wise hits. |
| Contribution of Referrer | This pie chart shows contribution of different types of Referrer. |
| Time trend | Trend of login events over time. Useful to identify unusual spikes at a glance. X axis : date & time Y axis : count of events |
| Summary Table | Detailed data with timestamp and count |
Some suggestions for useful interaction with this dashboard could be :
- On the bar graph "Contribution of Referrer" select any one. This shall isolate count of requested hits for selected referrer and also shows domain and server name for selected referrer across the dashboard. i.e the other pie charts, time trends and summary table shall show filtered information for this referrer only.
- Inversely, In the "Contribution of Domain" pie, click on the any one domain to select and rest of the elements on the dashboard then show data for that domain only.
Report_Webserver_Referrer_Detail Dashboard
This dashboard shows referrer details. Also it shows top URL's and client ip which are requested for URL and server name.
Elements in the Dashboard are explained below :
| Visualization | Description |
| Contribution of Referrer | This pie chart shows contribution of different types of Referrer. |
| Contribution of URL | This pie chart shows contribution of different types of URL . |
| Server Name wise Hits | X axis : Servername Y axis : Count of request hits for that Servername. |
| Client IP wise Hits | X axis : ClientIP Y axis : Count of request hits for that Client IP. |
| Time trend | Trend of login events over time. Useful to identify unusual spikes at a glance. X axis : date & time Y axis : count of events |
| Summary Table | Detailed data with timestamp and count |
Some suggestions for useful interaction with this dashboard could be :
- In the pie chart "Contribution of Referrer" click and select any one referrer type.This shall isolate count of hits for that selected type and also shows servername and accessed URL for that referrer type reflected across the dashboard. i.e the other pie charts, time trends and summary table shall show filtered information for this referrer type only.
- alternatively,In the graph "Client IP wise Hits" click and select any one clientIP. This shall isolate request hits and also shows referrer and accessed URL for that clientip reflected across the dashboard.
KHIKA Alerts for Apache WebServer
Alerts are generated when certain critical behavior is observed in the system – real time and notified on the Alerts Dashboard in KHIKA as well as can be received in email to relevant stakeholders. The details of KHIKA Alerts are mentioned here Click on “Alert Dashboard” on left menu. Certain alerts for Windows are pre-canned and shipped with KHIKA, keeping in mind the requirements of the users. They are mentioned in the table below :
Alerts Description
| Alert Name | Description | Suggested Resolution |
| Apache excessive web server errors from same source ip | This alert is triggered when same sourceIP trying to communicate with Apache Webserver and got error message with in one minute | Getting multiple errors from the same source_ip. Possible DDOS attack.
Denial of service attack (DOS) is an attack where the server is prevented from serving legitimate users with a response to their request. Prevention of DOS attacks from anonymous sources can be ensured by implementing a web server firewall that inspects the entire HTTL traffic and stops any data packet that appears malicious or is generated from a source that is not authorized. Check the reputation of client ip address and block it if necessary. |
| Apache dangerous content posted to webserver | This alert is triggered when any of the source trying to posted some dangerous files on webserver with in one minute. | Apache dangerous content posted to webserver. Victim has posted some potentially dangerous files like executable, scripts, shared objects, etc. on webserver
Kindly check upload activity done by the user and verify the uploaded content for policy violation. |
| Apache communication with possible IOC or bad IP | This alert is triggered when Malicious/bad IPs are trying to communicate with apache Webserver. | KHIKA shares community based threat intelligence (TI) every 24 hours. TI has list of IP addresses with bad reputation. Every bad IP is marked with number of communities reporting it, name of each community and confidence indicating how confident are we about the reputation. This alert is generated when communication with a bad IP is let through.
If communication with a bad IP is happening, it must be blocked immediately as it could be a possible attack or data exfiltration. You can check how log this communication is happening by simply searching the malicious IP in the logs. You can also check what internal IP addresses are communicating with this IP addresses and track the real users behind those internal IP addresses. Cross-check the reputation of the IP with popular websites such as ipvoid.com, virustotal.com If you see an internal IP constantly getting involved in malicious communication (with same or multiple external IP addresses), you may install agents on the internal nodes involved and check the real user and process responsible for this communication. It is critical to block this rogue communication. |
